I am right now sitting at Heathrow Terminal 5 in London on my way outbound to a two week stint in the Silicon Valley (Sunnyvale/Mountain View) to meet with the US team. And here are the things that made me happy this morning:
Ian Pouncey continues to put together good thought-pieces on accessibility with Web Accessibility Myths.
Liz Danzico wrote a wonderful piece called confidence for good on how making a leap of faith in your career is sometimes very necessary.
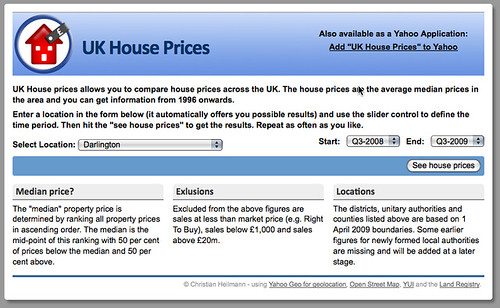
UK House Prices, my entry to the data.gov.uk application showcase went down really well on the day of the release and got about 5000 hits on the first day. Now to pester the UK government to do more YQL and expect less SPARQL.
Constructing a POUR web site has some very solid advice on how to build a good web site. I am tired of people shoe-horning new acronyms though. POSH was a bad idea, so was HIJAX. Not because of what they stand for but for giving a way out. Hearing sentences like “yeah the solution is bad now, but we will go for a POSH one soon” or “this will be redesign with HIJAX in mind at a later stage” make me want to scream – an I heard both several times.
UK-House-Prices.com is a web site to see how the prices in a certain area changed over the years using a data set released by the UK government as part of the data.gov.uk initiative.
The first step was to get the right data. I was lucky enough to be invited to the initial “hack day” and pre-release of the data and looked around for something to mash up. Initially I wanted to do something with environmental data but I found a lot of it to be very old. Therefore I just did a search for “2009” at data.gov.uk and found that the house prices data from 1996 to now in England and Wales is available. The plan was set. This was it:
I wanted to build an interface to show this information that was very fast, very portable and show a nice map of the area next to the numbers.
I wanted to build this as a web app and as an application for the Yahoo homepage (as I needed to build one as a demo anyways)
Traffic and speed was the most important issue – as this might get huge.
Cleaning and converting data
I got the spreadsheet and was confronted with my old nemesis: Excel. After saving the sheet as CSV and spending some fun time regular expressions and split() I had the data in a cleaner, and more usable version (JSON, specifically). One fun part is that when there was no data available for a certain area the field was either “..”, “n/a” or just empty. Something to work around. The numbers were also formatted like 100,312 which is nice on the eye but needs un-doing when you want to sort them outside Excel.
Once I had the list of locations and their numbers I wanted to turn them into geographical locations to display maps of the area. For this I used Yahoo Placemaker, especially the YQL table (see an example for Rugby in the YQL console). This is the script I ran over the list of locations:
The next thing I wanted to add was some more information about the area which meant using maps. As both Yahoo and Google maps have static map versions but are rate limited I wondered if there is a free version of that. And there is. Openstreetmap was the answer, especially the somewhat unofficial API I found with Google. To play safe, I wrote a script that gets the images and I cache it on my server to avoid killing this API.
I also wanted to show currently available houses in the area in case you are looking to buy. For this the natural choice for me was to use Nestoria as they also have an open YQL table (see the Nestoria table in the YQL console). So I used YQL and sorted the results by date:
select * from nestoria.search where place_name="Rugby" | sort(field='updated_in_days')
Price: '.($r->price_formatted).', Type of property: '.ucfirst($r->property_type).', Updated: '.($r->updated_in_days_formatted).' ('.($r->updated_in_days).' days)
';
echo '
Listed at: '.($r->datasource_name).' by '.($r->lister_name).'.
';
echo '
';
}
echo '
';
}
}
Finding a charting solution
Adding interactive charts was the next step. I had a few issues with that:
While Google charts are full of win, they are rate-limited and I didn’t want to pull images. As the app was also meant to become a Yahoo application every image would have to be run through Caja for safety reasons which slowed it down.
Canvas and Flash solutions like YUI charts or Raphael were also not possible because of the performance of the YAP app.
I put all these solutions together and built a small API that will give me the search results with three parameters: the location as an id and the start and end of the time range.
To build the interface, I went all-out YUI. I took the YUI grids builder to create the main layout, the AutoComplete demo, the dual slider demo and the button and put them all together. Add an Ajax call to the form, and you are done. OK, I admit, there was quite a bit of cleaning up to be done :)
Notice that I am using progressive enhancement all the way. Without JavaScript you get dropdowns:
That’s it
The next thing I had to do is move the app over to the Yahoo Application Platform which was easy as I based it on an API - but this is another blog post :)