The Open Data Group of the lovely area of Warwickshire in England is running a hack competition right now and they ask hackers to build something cool with their data sets.
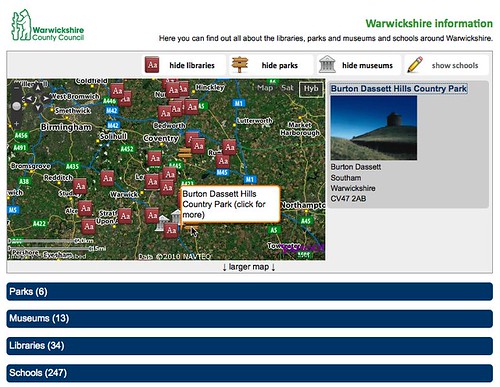
I looked at the catalogue of offers and took the simple way out – I created a mashup showing you the parks, museums, schools and libraries in the area both as lists with all the information and a an interactive map.
You can see the result here and by clicking the screenshot below.
In the following screencast I am talking people through the ideas and how I build the mashup:
If you want to build it yourself, get the source code from GitHub and here’s a quick step-by-step:
In the beginning, there was data, and it was good (to a degree)
The first thing I went for was to get my datasets:
Notice that the last dataset is vastly different to the others (uppercase elements for a start) and also that it contains the gem of 52.4786839 – would be good to spell-check your elements :) (that cost me 20 minutes of my life later on).
Now, I could load all of these one by one and then start converting the data to a useful format but as I am lazy I use YQL for that:
select * from xml where url in (
"http://ws.warwickshire.gov.uk/parks.xml",
"http://ws.warwickshire.gov.uk/libraries.xml",
"http://ws.warwickshire.gov.uk/museums.xml",
"http://opendata.s3.amazonaws.com/schools/schools-warwickshire.xml"
)
This, sent to the right YQL webservice endpoint results in an aggregated XML document and means I only have to have one HTTP request to load the data. Check this link to see the aggregated file.
Planning the mashup
Now, I’ve built mashups like these tons of times and mostly they end up to be a quick but terrible mess. Therefore I thought I change my approach. As the main solution I simply wanted to show a list of all the parks, museums, libraries and schools. This would work regardless of environment and ability of the user agent. Instead of assembling a JSON object to plot the information on the map I wanted to use the HTML as my data source by adding some classes (much like Microformats were meant to be used before the world forgot about them to chase CSS3 transition effects).
The HTML and CSS
So the first thing to do was to make sure my CSS works out fine. I did this by using the YUI CSS grids for my layout (building the interface with the grids builder)
This gave me an HTML skeleton to work from and also got rid of all the font issues across browsers which meant that in the end all my CSS file had to do was to show and hide things and put on a lick of paint (don’t judge me – I built this in FireBug).
The last thing I needed was a container DIV with a placeholder for the map and one for the information to be displayed about the marker the user clicked on the map:
Retrieving and converting the data
With that out of the way, all I needed was to get the data from YQL into my own HTML - for this I used PHP and cURL:
$yql = 'select * from xml where url in ('.
'"http://ws.warwickshire.gov.uk/parks.xml",'.
'"http://ws.warwickshire.gov.uk/libraries.xml",'.
'"http://ws.warwickshire.gov.uk/museums.xml",'.
'"http://opendata.s3.amazonaws.com/schools/schools-warwickshire.xml"'.
')';
$url = 'http://query.yahooapis.com/v1/public/yql?q='.urlencode($yql).
'&diagnostics=false&format=json';
$ch = curl_init();
curl_setopt($ch, CURLOPT_URL, $url);
curl_setopt($ch, CURLOPT_RETURNTRANSFER, 1);
$output = curl_exec($ch);
curl_close($ch);
$data = json_decode($output);
This gives me all the data in the $data variable as a native PHP object. All that I needed to do was to analyse the data coming back and wrap it in the right HTML.
Displaying the HTML for each section
echo 'Parks ('.
sizeof($data->query->results->parks->park).
')
I add a DIV with the class section around each of the parts I want to show and wrap the results in an unordered list with an ID. I add a class called hasimg to the list items that contain an image to allow for the right CSS layout and I wrap the name of the section in a SPAN with the class name. This allows me later on to read this information to plot it on a map. Each list item also gets a running ID of p1, p2, p3 and so on which allows me to read the information when the user clicks the marker on the map.
I’ve written a small helper function called addpara() to only write out the paragraphs of elements that have content as I wanted to avoid empty P elements. The section ends with a P with the class geo which contains a SPAN with the coordinates – once again to allow me to plot it on a map.
This gets repeated for parks, museums and libraries but the schools data set needed special treatment. First of all the format was different, but it also returned data in uppercase, which is just not fun.
That’s why I used ucwords() and strtolower() to clean up the data before displaying it:
echo 'Schools ('.
sizeof($data->query->results->RECORDS->SCHOOL).
')
That’s the lot. If you turn off JavaScript in the mashup you can see the outcome of these efforts – a long list of different sights preceeded by a heading.
Adding the map and collapsing the sections
The next step in the process was to ad the JavaScript functionality. I added a class called js to the body of the document when JavaScript is available and included the Yahoo Maps API and the YUI library. The latter allows me simple and browser independent access to both the DOM and events in the browser, the former is of course needed to show the map.
Adding the class to the body saves me a lot of trouble. Instead of looping through all the lists and hiding them (as I want to show and hide them when you click on the headers), I can now do that in the CSS:
body.js .section ul{
position:absolute;
left:-9999px;
height:10px;
overflow:hidden;
}
body.js .show ul{
position:relative;
left:0;
top:0;
height:auto;
overflow:auto;
}
This hides all the lists and when I want to show them all I need is to add a class called show on the containing DIV.
Finishing up with the rest of the JavaScript functionality
The JavaScript to do the rest of the functionality is no magic:
wws = {};
YUI().use('node',function(Y){
Y.one('body').addClass('js');
Y.all('.section h2').set('tabIndex',-1);
Y.all('.section ul').set('tabIndex',-1);
Y.one('#info').set('tabIndex',-1);
[...]
});
I define wws as a namespace, but I don’t need to worry about embedding the code in the closure as YUI’s use() method does that for me. I add the class to the body (as the HTML maintainer might remove the other JavaScript that does that – it is only there to fire as soon as possible). Then I add a tabIndex of -1 to all the elements I want to make interactive – this makes them available to keyboard users.
Using the wonders of Event Delegation it is very easy to make all the H2 headings in the #bd clickable and show and hide the following ULs:
Y.delegate('click', function(e) {
e.preventDefault();
var dad = Y.one(e.target).ancestor('div');
if(dad.hasClass('show')){
dad.removeClass('show');
} else {
dad.addClass('show');
var next = Y.one(e.target).next('ul');
next.focus();
}
}, '#bd', 'h2');
I add and remove the show class to show and hide the ULs and move the focus to the list when the header is clicked.
Next I wanted to explain to the end users what can be done here. You will find a lot of mashups that will have this info in the HTML but what if JavaScript is not available? You explain functionality that is not available and confuse users. This is why I add the information to the info section and add a class to allow for different styling as this section will be re-used to show the information of the marker I clicked on.
Y.one('#info').set('innerHTML',
'Get all the information here
'+
'Click any of the icons on the map to the right to get '+
'detail information about the location.
'+
'You can make the map less busy by turning features on and off'+
'with the buttons above.
'
).addClass('intro');
Next up I start the map:
var points = [];
wws.map = new YMap(Y.one('#map')._node);
wws.map.addTypeControl();
wws.map.addZoomLong();
wws.map.addPanControl();
wws.map.disableKeyControls();
wws.map.setMapType(YAHOO_MAP_HYB);
The points array will hold all the points I want to show on the map. Yahoo maps can get the right zoom level and map centre automatically for you when you give it an array of points. I disable the key controls to make sure the map doesn’t interfere with page scrolling and define hybrid as the map type. As the map needs to be globally accessible I attach it to the wws namespace.
var parks = Y.all('#parks .name').get('innerHTML');
var parklocs = Y.all('#parks .geo span').get('innerHTML');
for(var i=0,j=parks.length;i
And off we go.
So what’s going on here? I read the names of all the parks and the location of all the parks using the Y.all() method of YUI3. I then loop over the parks, split the coordinate information on the comma and create a new GeoPoint from it. I add the point to the points array, define an image for the point and create a new YMarker. In the marker I add the point, the image and a running ID. This will label the markers internally as mp0, mp1, mp2 and so forth. This I need to connect the marker with the content section in the list (remember I added a running ID on the list items when I wrote them out in PHP).
I then add a capturing function to the marker that fires when it is clicked. In this one I read out the ID of the marker (using the rather obtruse i.thisObj.id property), remove the “m” from the ID and get the content of the element with this ID - which is the connected list item. I send the content to the showinfo() function.
Furthermore I add an AutoExpand with the name of the park and a “click for more” message to the marker and add it to the map.
This functionality is repeated for all the different sections which seems a waste but years of building this kind of stuff taught me that a few weeks down the line you will have to make amendments for different sections anyway so a bit of copy and paste doesn’t hurt.
var zac = wws.map.getBestZoomAndCenter(points);
var level = zac.zoomLevel;
wws.map.drawZoomAndCenter(zac.YGeoPoint,level-2);
I get the best zoom level and the centre of the map and draw it. I remove two levels from the best level as the markers are very dense on this map and I didn’t want to overwhelm the end user.
Y.one('#container').append(
''
);
Y.one('#container').prepend(
''+
''+
''+
''+
''+
'
'
);
I then needed some interactive elements to allow resizing of the map and to show and hide the different markers. For this I create buttons as that is what they are there for – firing JavaScript functionality. I add the buttons to the container element and give each an ID to differentiate between them.
Y.delegate('click',function(event){
var t = Y.one(event.target);
switch(t.get('id')){
case 'size':
if(t.get('innerHTML').indexOf('smaller map')!=-1){
t.set('innerHTML','↓ larger map ↓');
Y.one('#map').setStyle('height','280px');
} else {
t.set('innerHTML','↑ smaller map ↑');
Y.one('#map').setStyle('height','600px');
}
break;
case 'librariesbutton':
if(t.get('innerHTML').indexOf('hide')!=-1){
wws.toggleMarkers('ml',0);
t.set('innerHTML','show libraries');
t.addClass('inactive');
} else {
wws.toggleMarkers('ml',1);
t.set('innerHTML','hide libraries');
t.removeClass('inactive');
}
break;
[... repeated for the others ...]
}
},'#container','button');
Again I use event delegation to attach functionality to all buttons in the container element and differentiate by reading out the event target and its ID. For the resizing button I resize the map and change the content of the button. For the other buttons I call the toggleMarkers() method using the string to identify the markers and a boolean to turn them on or off and change the content of the button. To allow for extra styling I also add and remove a class called inactive.
wws.showinfo = function(html){
Y.one('#info').set('innerHTML',html).removeClass('intro');
if(Y.one('#info a')){
Y.one('#info a').focus();
} else {
Y.one('#info').focus();
}
};
The showinfo() function simply changes the content of the info element and removes the intro class to trigger the less “in your face” style the intro blurb had. It then checks if the content contains a link and sends the focus of the document to that one – or to the info element itself. This helps keyboard users.
wws.toggleMarkers = function(str,what){
var markers = wws.map.getMarkerIDs();
for(var i=0;i
The toggleMarkers() method retrieves all the marker IDs from the map and loops through them. If they match the ID string sent through by the button event handler it shows and hides all the markers of a certain type. Notice that the opposite of hide() is unhide() in the Yahoo Maps API :/.
That’s all folks
And that is the mashup – some styling in Firebug, a few PHP tricks to pack the content before sending it on the wire and doing local caching and I was done. And so can you. Go forth and hack.