Christian Heilmann

You are currently browsing the archives for the General category.

Archive for the ‘General’ Category

Locking editor panes in Visual Studio Code prevents unwanted multi-tab experiences

Wednesday, September 8th, 2021

When using the Edge DevTools for VS Code extension inside the editor, one thing that I kept doing wrong was opening files accidentally next to the tools.

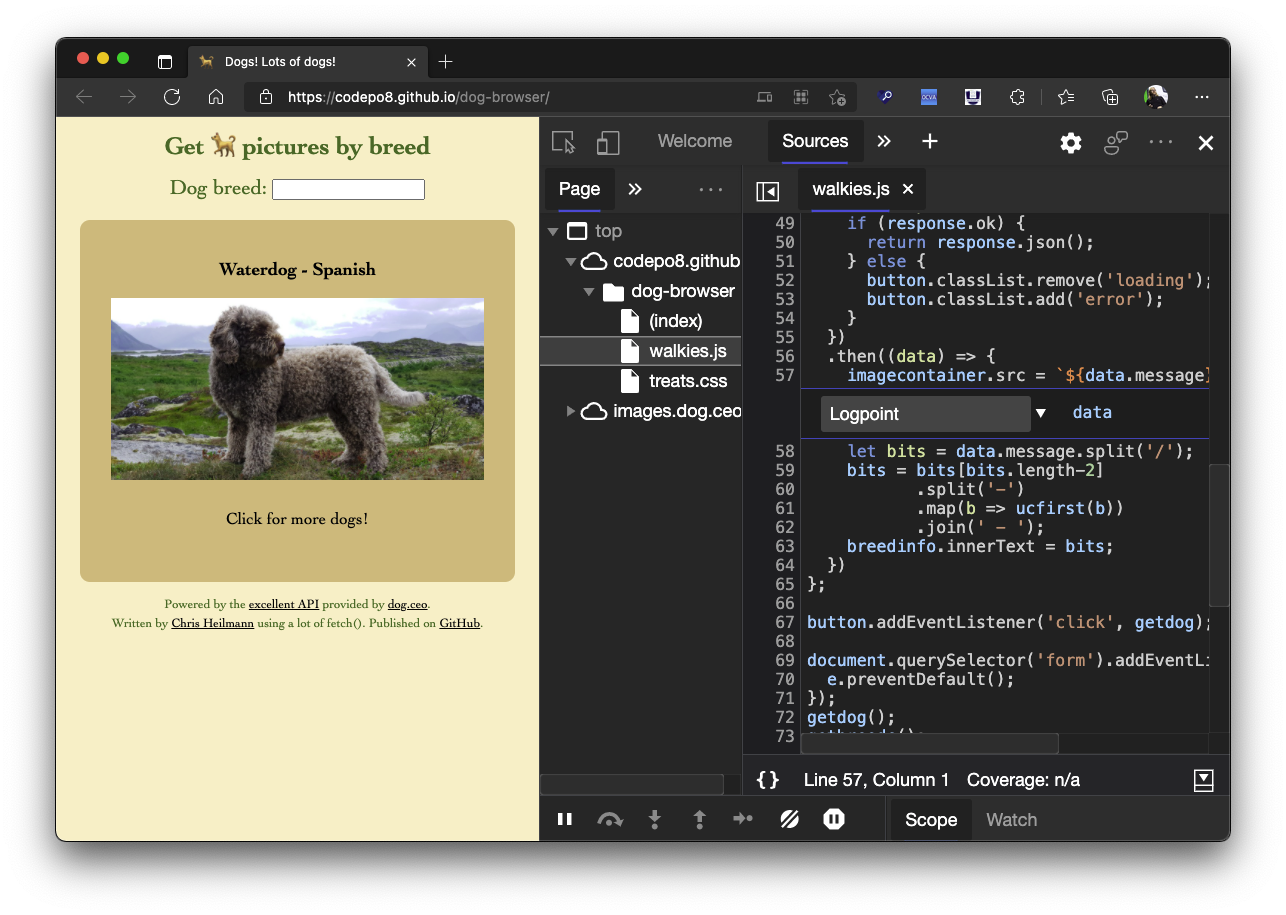
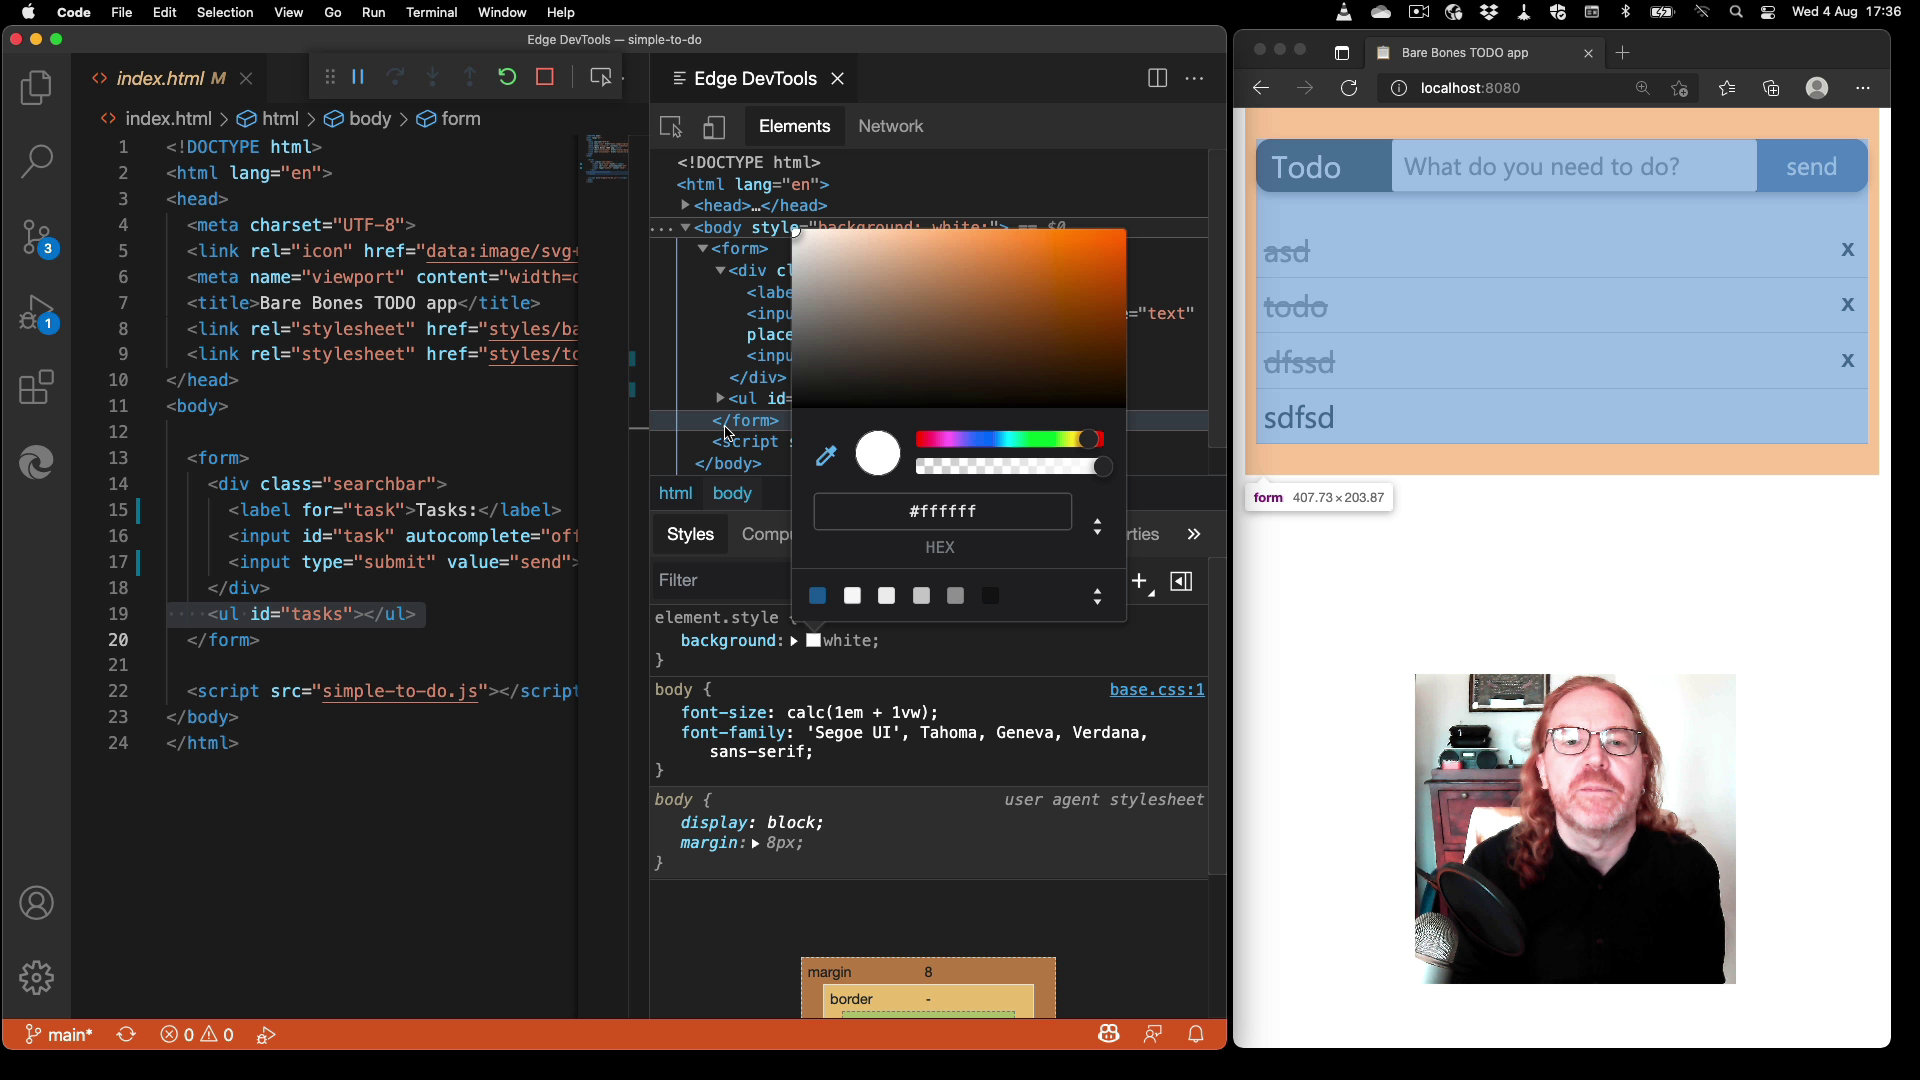
By default, the tools show up as their own pane next to the main editor. This is an editor pane of VS Code, and thus supports many things, including tabs.

Edge DevTools open in Visual Studio Code

When I use the tools, this group has focus. And when I go open another file to edit, it opens as a new tab next to the tools. Many a time this messed up my screencasts.

File accidentally opened next to the DevTools instead of the main editor

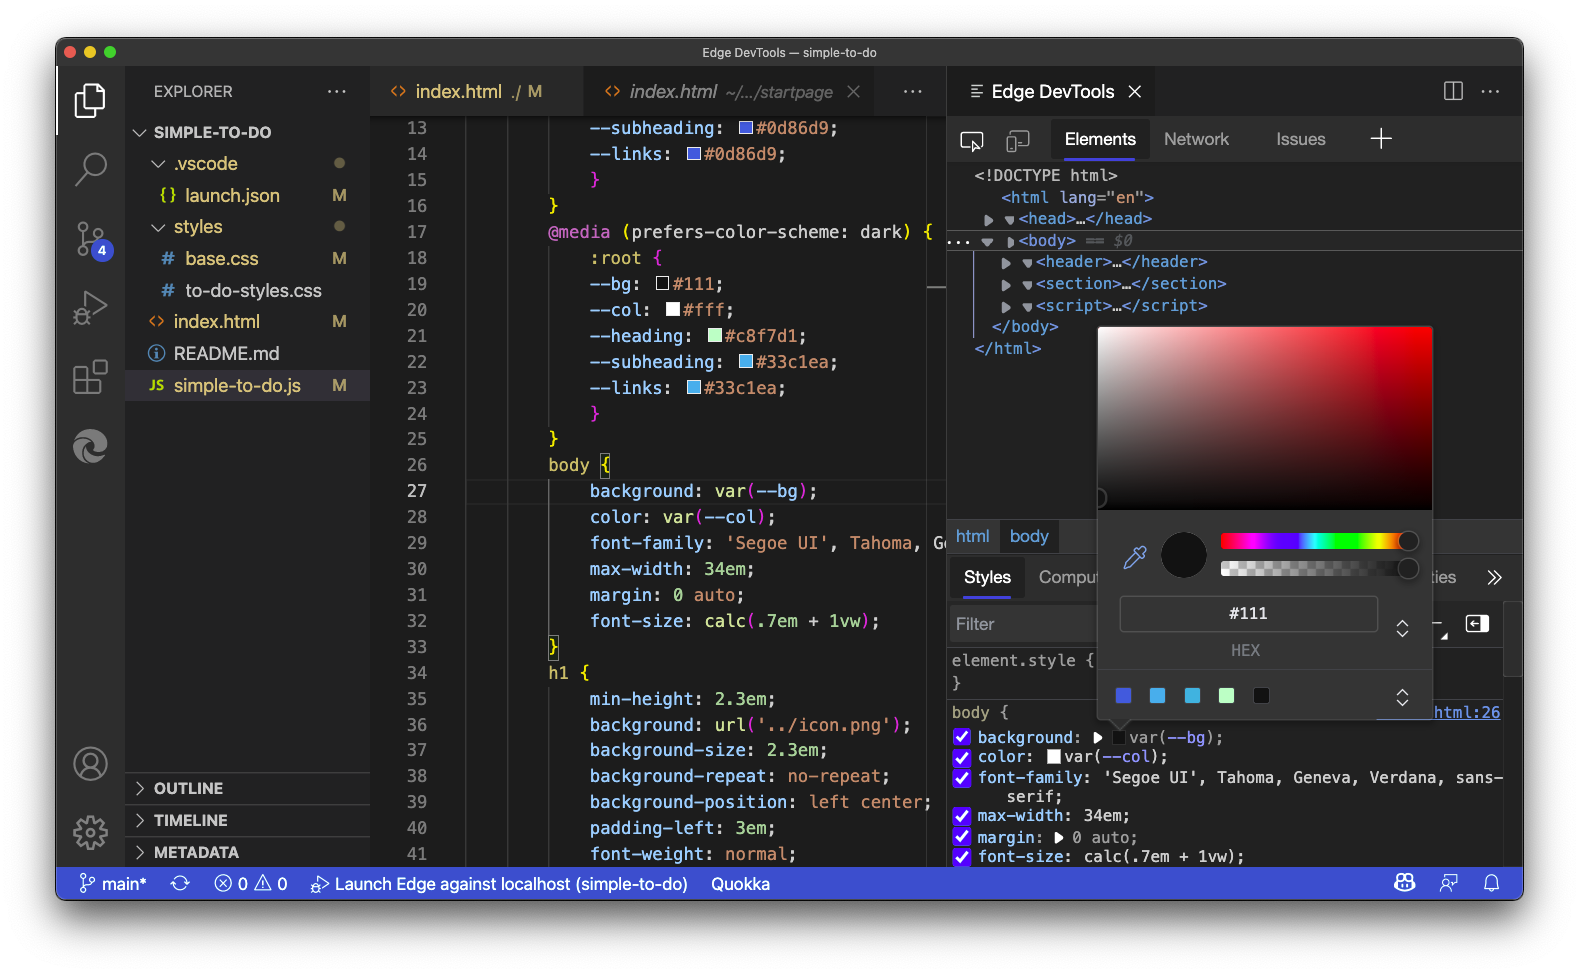
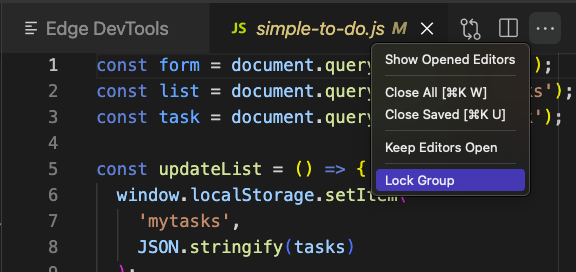
The trick is to lock the group with the tools in them. You do that by activating the … menu of the tools pane and select “Lock Group”.

Locking the pane with the DevTools Extension

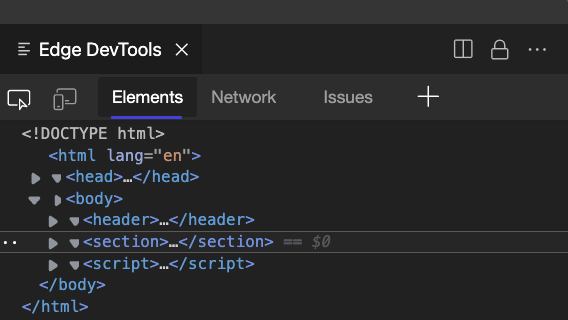
The locked group then shows a lock icon and no other files will open as tabs on it, even if it had the focus.

Locked pane

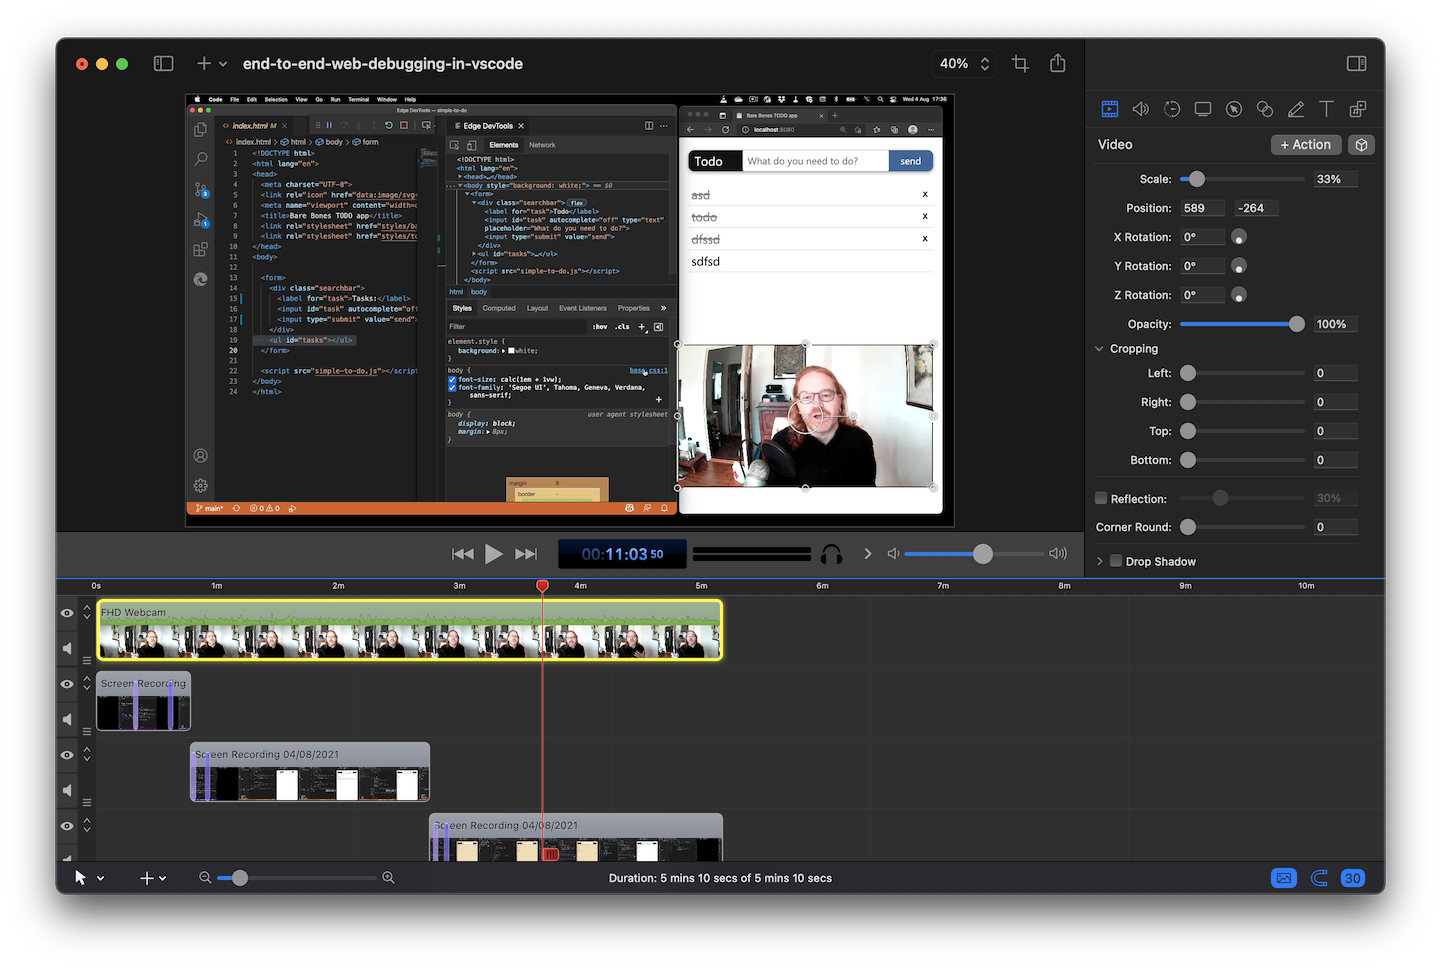
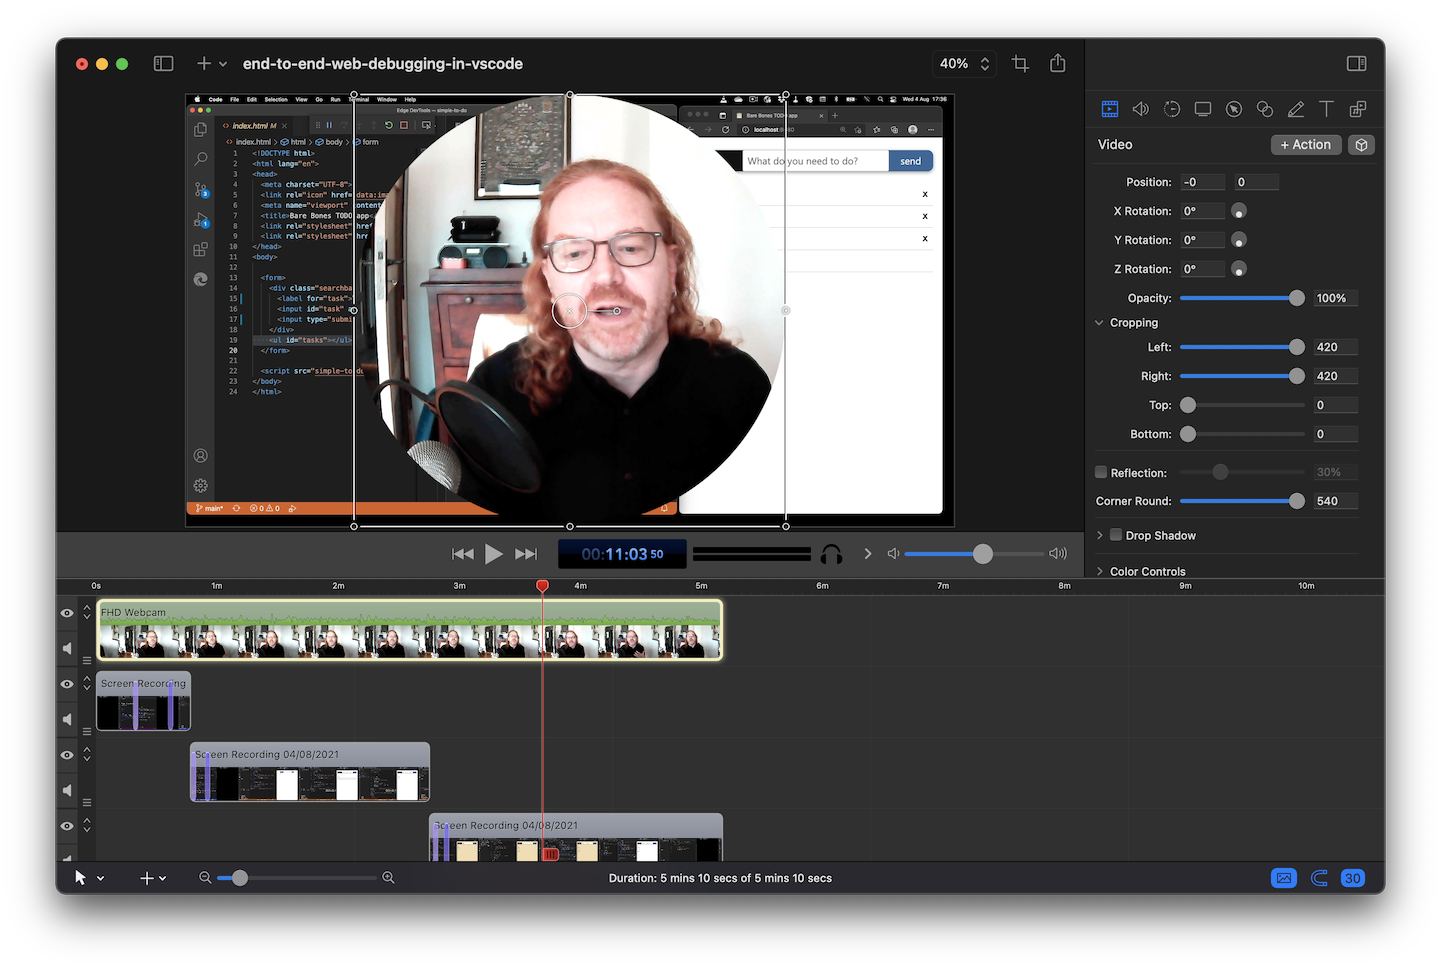
You can see this in action in the following screencast.

Using console.log() on any website? Logpoints let you do that!

Tuesday, August 24th, 2021

The demo page with developer tools and the logpoint editor open.

If you want to know the value of a certain expression in any JavaScript on the web, you can use logpoints for that. It is like injecting a console.log() anywhere you want.

Here’s a quick demo:

Here’s how the demo works:

  • Open https://codepo8.github.io/dog-browser/ in the browser
  • Open Developer Tools, go to the Sources tool
  • Locate ‘walkies.js’ and open it
  • Right-click the line number where you’d like to add a logpoint – in this case line 57
  • Select Add logpoint to open the editor
  • In the Editor, enter the expression that you’d like to log – in this case “data”.
  • Hit Enter to save and a badge shows on the line number.
  • Go to the Console, interact with the site and every time line 57 executes, you see the result of the logpoint expression to the console.

You can set as many logpoints as you want. Clicking the badge again removes them.

Quick tip: creating round “talking heads” videos in Screenflow

Monday, August 23rd, 2021

Adding your face in a small circle to videos has become fashionable lately and some extensions do that automatically for you. Good old Screenflow, which I’ve used for years now, has no masking option though. But you still can achieve round videos using a setting and learning that screenflow’s sliders are weird.

By default, Screenflow will record the video in full size (in my case 1920 by 1080 pixels), resize it and place it on the bottom right.

The default size and setting of the camera recording in Screenflow

Make sure the video is active, indicated by a yellow border around it, and select the Video tool. This gives you all kind of settings to play with. First, reset the scale to 100% and the position to 0 and 0, which shows the video as full screen covering the other recording.

Resizing and placing the video to be full screen so that you can change the dimensions

Now you need to ensure that your video is square and that you set the right border-radius. The problem here is that Screenflow’s sliders don’t go further than 400. I suppose that’s some legacy debt when videos were 800 by 600 pixels. You can, however, enter any number in the text fields.

In my case, the video is 1920 by 1080, so in the crop setting I need to take 420 pixels from the left and the right as (1920 – 1080) / 2 = 420. For the radius I need to set 540 because the final video is 1080 by 1080:

The video settings panel with the right settings

And that results in a rounded video:

Final version of the rounded video

The last step is to set the scale and place the video. And you can add a drop shadow if you want to:

Scaled rounded video, placed bottom right with a drop shadow

Published on TikTok, but Kompressor does not dance

Wednesday, August 11th, 2021

Visual Studio Code now has a TikTok channel and they asked me if I wanted to contribute, so here you are:

@vscode

A look under the hood ##vscode ##techtok ##codetok ##programming ##edutok

♬ original sound – Visual Studio Code

A 20 second video of me explaining that I like VS Code a lot as it comes with DevTools built in where you can see how the interface was done with HTML/CSS and JS.

Here’s how I did it:

  • Filmed me saying all the things on my balcony with my phone
  • Recorded my screen using Screenflow doing the things that I talked about
  • Created a 1080×1920 new project in Screenflow
  • Added my video as the background (weirdly enough I had to rotate it 90 degrees)
  • Resized the screen recordings accordingly and added a zoom action to the second one.

Screenshot of the screenflow template with the different video streams and editing interface

I had a longer meeting with the VS Code team on the merits of TikTok and how you reach a different audience that way. And I learned that edutok is a thing.
I don’t like the portrait format for showing off full code editors or browser functionality where the app by default is landscape, but I can see doing more of these in the future for the VS Code team. As to me joining TikTok, not sure. It already annoyed the hell out of me that the video keeps looping while I am answering comments.

[Video] Learn how to debug web projects end-to-end in VS Code in 5 minutes

Monday, August 9th, 2021

Still of the video showing me debugging a web site in VS Code.

This weekend I released a video on the YouTube Channel of Visual Studio Code that shows end-to-end web project debugging.

In five minutes I walk through debugging a web project bit by bit:

  • I open a project inside VS Code by opening its folder. The demo used is a simple, plain Vanilla JS/CSS/HTML ToDo app you can download/fork on GitHub.
  • I open a Terminal inside VS Code and start a local server. I use the server that comes with PHP as it already on my computer (for now – MacOS will soon deprecate this option)
  • Instead of opening the project in the browser, I use the run and debug workflow of VS Code to open a dedicated browser instance to debug this project with. If I have a Chromium based browser on my device and have it set as my default browser, this will be the one VS Code uses. In my case, this opens a new window of Microsoft Edge, as this is my main browser on this MacOS computer (yes, it runs on Mac for over 1.5 years now). I use Edge to show extra functionality later that is only supported in this Chromium based browser.
  • Having a dedicated browser instance also means that I get the Browser Developer Tools Console functionality now inside the Debug Console of Visual Studio Code. The Debug Console shows any console.log messages from my JavaScript and I can also interact with the document in the browser using the Console convenience methods like $ for querySelector(). I have full access to the window object and can change the DOM and the styles of the document in a programatic way.
  • In addition to console.log() debugging I also have the opportunity to use breakpoint debugging instead, which gives me a lot more insight and also has the benefit of halting the execution of my script until I found out what’s going on.
  • As I am using Microsoft Edge as the debugging browser I also get an inspect button on the debugger toolbar. This one gives me access to the Edge Developer Tools right inside Visual Studio Code. This functionality is powered by the Edge Tools for VS Code extension which gets installed for me the first time I select the inspect button
  • Once the extension runs, I can access and change the DOM and the CSS of the current project right inside Visual Studio Code using the same tools I normally use in the browser.
  • I also have access to the Network tool to inspect any Network requests and see if there are any issues of content not being loaded.
  • In order to automate the process of starting the browser and opening the localhost address next time, I can also get the debugger extension to generate a launch.json file for me. Once I have that, next time all of the above happens automatically.

If you want to learn more about the JavaScript debugger in VS Code, you can check the documentation here or talk to Connor Peet on Twitter. For the Edge DevTools for VS Code integration you can read the extension documentation and check the code on GitHub. We’re also welcoming filing any issues on GitHub and you can talk to me, codepo8 on Twitter or the team at EdgeDevTools

A special thank you to the team involved in all this work, James Lissiak, Michael Liao, Vidal Guillermo Diazleal Ortega, Brandon Goddard, Olivia Flynn, Tony Ross, Rob Paveza, Jason Stephen, Connor Peet and of course the VS Code team.