[Video] Learn how to debug web projects end-to-end in VS Code in 5 minutes
Monday, August 9th, 2021 at 9:46 pm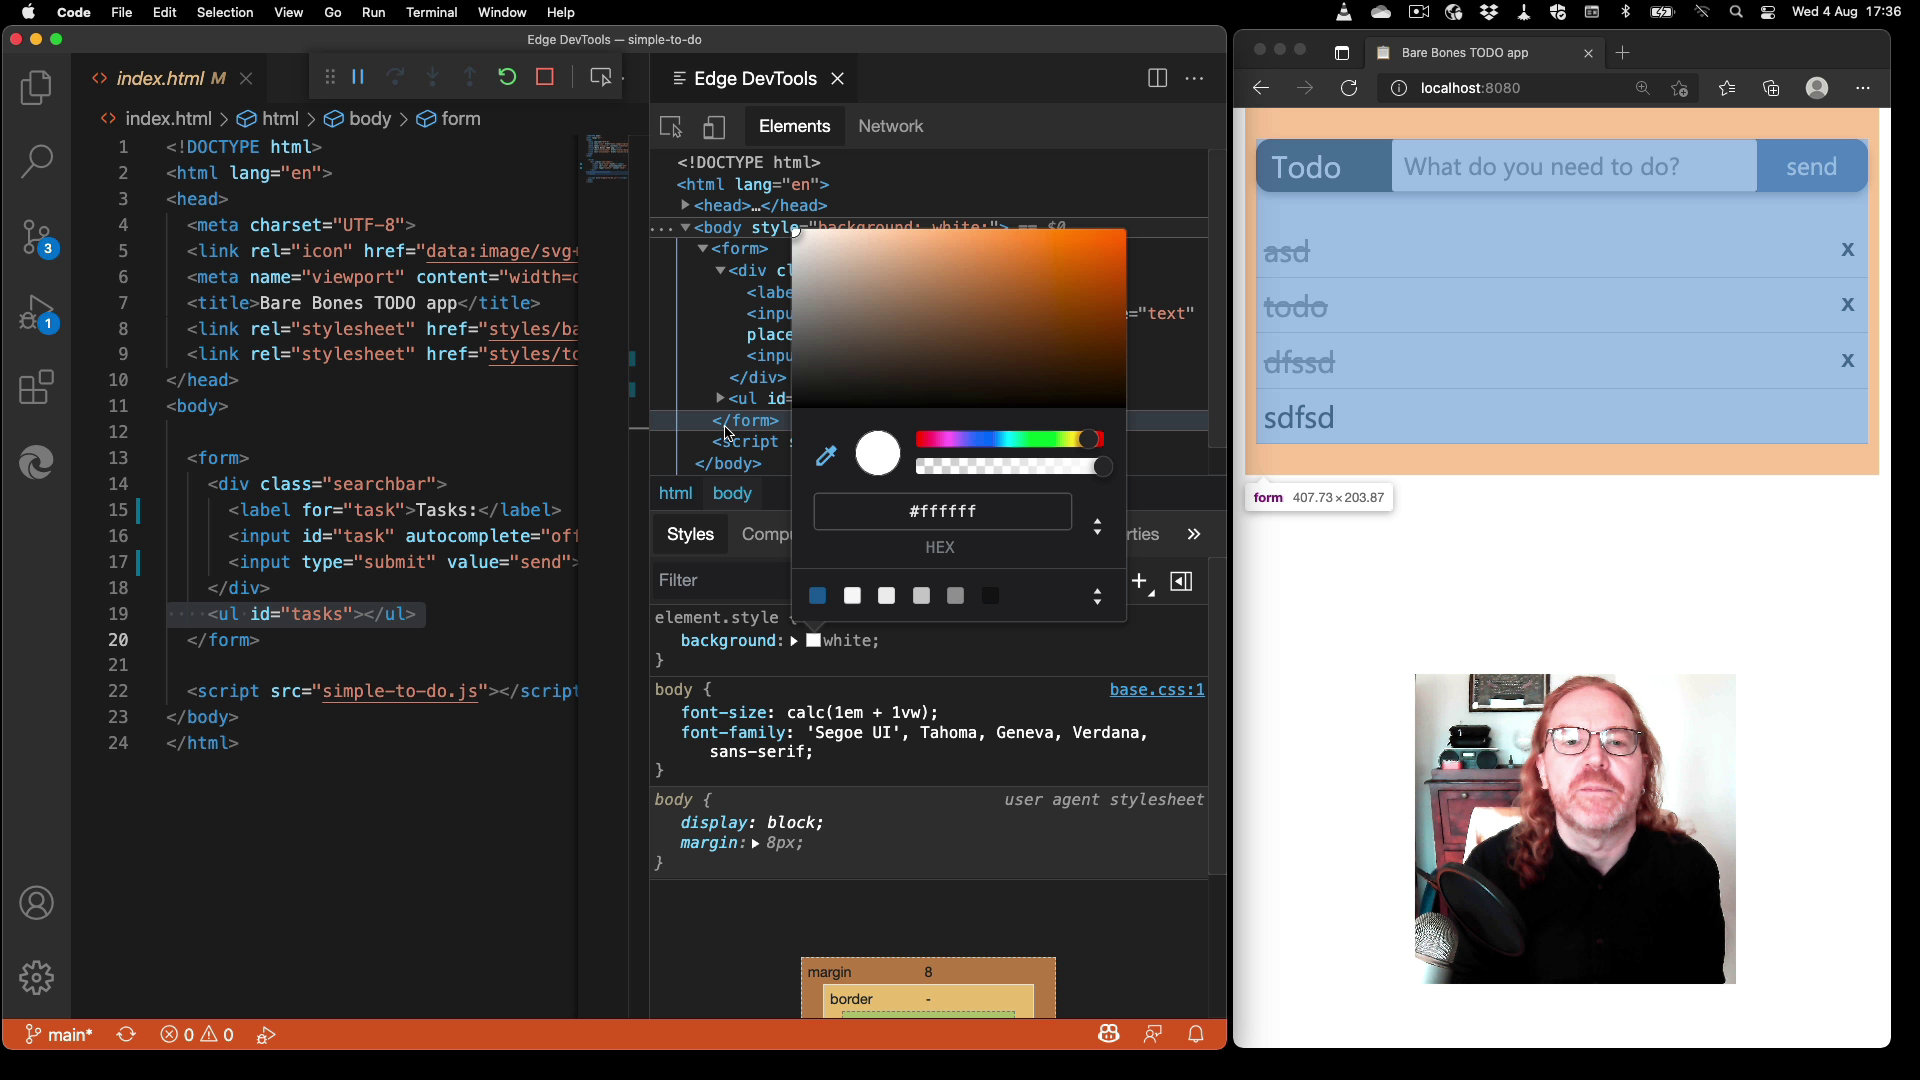
This weekend I released a video on the YouTube Channel of Visual Studio Code that shows end-to-end web project debugging.
In five minutes I walk through debugging a web project bit by bit:
- I open a project inside VS Code by opening its folder. The demo used is a simple, plain Vanilla JS/CSS/HTML ToDo app you can download/fork on GitHub.
- I open a Terminal inside VS Code and start a local server. I use the server that comes with PHP as it already on my computer (for now – MacOS will soon deprecate this option)
- Instead of opening the project in the browser, I use the run and debug workflow of VS Code to open a dedicated browser instance to debug this project with. If I have a Chromium based browser on my device and have it set as my default browser, this will be the one VS Code uses. In my case, this opens a new window of Microsoft Edge, as this is my main browser on this MacOS computer (yes, it runs on Mac for over 1.5 years now). I use Edge to show extra functionality later that is only supported in this Chromium based browser.
- Having a dedicated browser instance also means that I get the Browser Developer Tools Console functionality now inside the Debug Console of Visual Studio Code. The Debug Console shows any console.log messages from my JavaScript and I can also interact with the document in the browser using the Console convenience methods like $ for querySelector(). I have full access to the window object and can change the DOM and the styles of the document in a programatic way.
- In addition to console.log() debugging I also have the opportunity to use breakpoint debugging instead, which gives me a lot more insight and also has the benefit of halting the execution of my script until I found out what’s going on.
- As I am using Microsoft Edge as the debugging browser I also get an inspect button on the debugger toolbar. This one gives me access to the Edge Developer Tools right inside Visual Studio Code. This functionality is powered by the Edge Tools for VS Code extension which gets installed for me the first time I select the inspect button
- Once the extension runs, I can access and change the DOM and the CSS of the current project right inside Visual Studio Code using the same tools I normally use in the browser.
- I also have access to the Network tool to inspect any Network requests and see if there are any issues of content not being loaded.
- In order to automate the process of starting the browser and opening the localhost address next time, I can also get the debugger extension to generate a launch.json file for me. Once I have that, next time all of the above happens automatically.
If you want to learn more about the JavaScript debugger in VS Code, you can check the documentation here or talk to Connor Peet on Twitter. For the Edge DevTools for VS Code integration you can read the extension documentation and check the code on GitHub. We’re also welcoming filing any issues on GitHub and you can talk to me, codepo8 on Twitter or the team at EdgeDevTools
A special thank you to the team involved in all this work, James Lissiak, Michael Liao, Vidal Guillermo Diazleal Ortega, Brandon Goddard, Olivia Flynn, Tony Ross, Rob Paveza, Jason Stephen, Connor Peet and of course the VS Code team.