Explaining what YQL is to non-technical people
Monday, February 8th, 2010A friend of mine was asked to produce some videos and screencasts to explain YQL to non-technical people and asked me to give her a definition. Here’s what I came up with:
What is YQL and what is it good for ?
The Internet as we see it (web sites, games, videos) is only a shop window to the thing that really drives it: data. All the things you see are based on information one provider offers another provider. Even you are a data provider – if you comment on a video on YouTube or you add a person to a photo on Facebook you create a data set. All this data is made available behind the scenes to different people – this could be developers in the same company or partners or – for example in the case of the Yahoo Developer Network – other developers.
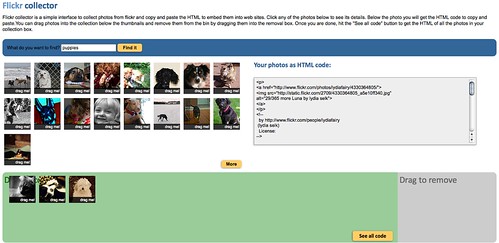
The information comes in different formats. For example the photos on http://www.flickr.com/photos/tags/cat are available in “JSON” format at http://api.flickr.com/services/feeds/photos_public.gne?tags=cat&lang=en-us&format=json.
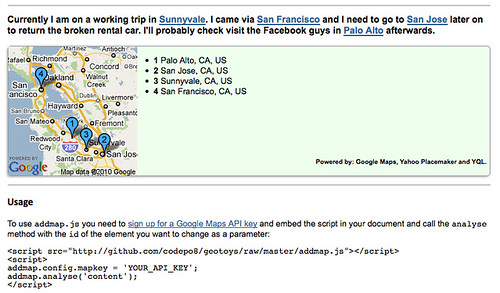
To you this might look like nothing much but developers have a lot of fun with this information. It gets especially interesting when you mix and match different information sources to get a new picture. You can for example map the news onto the world to give them geographical context.
All of this sharing of information follows certain conventions much like normal conversation does. You need to ask the right question to the right person in the right format to get the correct information back. In the case of data on the Internet this gets even more confusing as all the data providers speak different languages and give you information back in formats that you might not understand. Imagine going shopping for clothes and each shop assistant speaks a different language and each shop has different size charts for the same type of clothing.
In normal communication amongst people with different languages we have translators – sometimes even simultaneous ones. And this is what YQL is. YQL is a simple to understand language to allow you to get information from any source on the web and gives it back to you in a language you understand. Every resource on the web can get a simple name and developers can call this name up to get to the data it offers. So for example getting photos from flickr becomes
select * from flickr.photos.search where text='cat'Translating a text to French becomes
select * from google.translate where q='hubcap' and target='fr'You can also mix and match different sources, for example you can get the latest headlines from yahoo’s top stories and translate them to French:
select * from google.translate where target='fr' and q in (
select title from rss where url='http://rss.news.yahoo.com/rss/topstories'
)
This language is very close to another language called SQL which is the standard for accessing information in databases. So, in essence, YQL turns the internet into a massive database where developers can access information and remix it to make it easier for end users to see relationships between different pieces of information or even develop interfaces that make it possible for users to get access to the information.
For example this great lecture on YouTube can be listened to by blind users using the EasyYouTube interface that uses YQL to get to the information of the video.
YQL can be accessed on a pure programmatic level but the easiest way to get a glimpse of its translation and access powers is to use the console.
YQL is a great communicator – it allows you to speak to all kind of data sources in the right language, ask the right questions for you, find the right internal phone numbers to get to even other resources needed to get to a certain piece of information and give back to you only what you asked for and not a whole mass of information you will never need. And it is amazingly fast in doing so as Yahoo built it to deal with exactly the same problem of data communication inside the company.