A few days ago I was on vacation in a place that had terrible mobile connectivity and whilst it provided WiFi, nothing worked. I even brought my own cables and travel router, but to no avail. This was not only a good opportunity for some “digital detox”, but it also showed me once again that the web isn’t as resilient as we want it to be.
Here’s what happened: one evening we went to the hotel lounge to play some games. They had a library with some, but the one thing that was missing was a dice.
Not to worry, I thought, and went to look on my mobile phone to get a quick dice solution on the web. There are a lot out there, but here’s the kicker: I couldn’t find any that loaded quickly and subsequently worked offline. None. At. All. Any web search for “offline dice” resulted in tons of apps advertised to me. Other online solutions are riddled with ads and have a first load of several megabytes. Interestingly enough, searching on Desktop has better solutions – the place were you are less likely to need a simple solution that works offline. There is also a huge difference between search engines.
Even those that are excellent in their randomness like the one on random.org do a reload of the whole page on every “throw” of the dice. Others implemented the sides of the dice as images and didn’t preload them.
“Simulating a dice throw” is an example of every programming language tutorial I’ve ever seen. I remember learning BASIC and Pascal and these were parts of it. I’ve also seen this come up in job interviews back in the day. Offline functionality is also not that hard to do. A simple single-purpose web product like a dice simulator should be not hard to release. It seems the lure of selling it on an app store or making money with it by surrounding it with ads is a bigger incentive though.
The solution was to go back to the hotel room, get my laptop and write a JavaScript solution in a local file whilst my partner went out for a cigarette break. I am not proud of the code, but I also had a few drinks before – and it did the job.
It made me think though. Despite dozens of tutorials, books, presentations and videos, considering offline and bad connectivity is still not ingrained into our thinking as developers.
When HTML5 became a thing and the web went mobile first, offline availability was a main need to match native apps. Earlier approaches like AppCache had a lot of issues which is why we came up with ServiceWorker. ServiceWorker went through a lot of iterations, and as it was designed to cater to a myriad of use cases, it became complex. Many people use abstraction libraries like Workbox instead.
And, I am to blame, too. Last year I released a dice emulator for fun and the thing I didn’t do is to make it work offline. Although it was a single HTML document. Now I added that functionality. So if you go to it now, it loads quickly even on a horrible connection and will subsequently work offline. You can also install it as an app.
I will write up in detail how to do that, but the source code should give most of the clues. The biggest obstacle was to make it work with GitHub pages rather than a bespoke domain (which I may add later).
To me, this taught me to be more concerned about edge cases of our users. I want the web to be there for people when they need it. And if the functionality they need is a random number between 1 and 6 they shouldn’t have to download an app for that. So let’s embrace a flaky web in everything we do.
Posted in General | Comments Off on Offline? No dice!
After 25 years of working for, on and with the web, I am looking at the current state of it and I don’t like it. There is still a lot of beautiful, creative and amazing work out there, but on the whole, we lost an amazing opportunity. In its place we have a consumption machine that creates bubbles and assumes new users to be incapable of making own decisions.
I’ve talked about the sorry state of the internet back when it was all about replacing it with apps in my keynote of the Internet Days 2016.
And now, five years later, I’m not sure things recovered and got better. Instead I have a feeling that the basic ideas of the web became forgotten.
Hello world web
Let’s go back to when I started with the web. I’ve been on BBSes, Newsgroups, IRC, mailing lists and swapped floppy disks via mail before that. All to get information and software. Then the web came around and I got hooked immediately. For my personal use, the first things I visited were demo scene related – a remnant of the BBS days. From a professional point of view, I worked as a newscaster in a radio station. Having access to the web gave me access to the news feeds from the German Press Association at any time. Before that, we got faxes with their gist every morning to work from. As I used that wild new thing called world wide web, we had more information than other stations or newspapers. This helped my career a lot.
The link was the currency
The information flow was pretty much dependent on knowing the source. You learned about different URLs from discussion groups, forums, IRC and mailing lists. You spent a lot of time maintaining a great favourites folder or – in my case as a die-hard Netscape fan – your bookmarks.html document.
As a publisher, you submitted your sites to site directories like Yahoo Directory, or dmoz – another very early player. You also connected to other site maintainers and exchanged links or joined web rings to connect with similar sites. All for free, as your main interest was to get people to read and consume what you wrote.
I’ve blogged since 2005 and your blogroll was a sign of pride. You connected to other publishers to show your shared respect and ideas, not to get lots of links back.
And then there were search engines
In the beginning search engines were hit and miss. I remember using Altavista, Lycos, Dogpile, Hotbot and in Germany Web.de and Fireball. Fireball was the first I remember that had live search results being displayed. And as there was no filtering, you can guess what the outcome of that was.
With the rise of Yahoo to a search engine, and especially with the emergence of Google this all changed. Most of the smaller search engines got bought or died. Some specialised to certain markets and subject matters to survive.
But fact of the matter was and is that Google rules supreme and more and more a search result was much more important than maintaining good links.
Now, I don’t want to venture into Search Engine Optimisation (SEO) discussions here as I already had a shower and don’t want to scrub myself again. But, I am pretty certain that whilst having a good, solid, URL with a great structure for human readability still has merits, most success with search engines these days is ads and payments. Link farming, creating tons of fake web sites all linking to another and other dirty tricks of SEO made sure of that.
I get emails daily from people asking me to write “relevant content posts with a few links” for my blog. I specifically state in my about page and on my footer that I don’t publish third party content, but that doesn’t matter to an automation bot. It goes to show that old content that was part of dmoz and others does still count to a small part. But it also shows that there is a lot more gamification and “growth hacking” at play than publishing good content and hoping for an audience.
And this comes to me with disastrous consequences to the web I got to love over the years. Search engine results – especially on mobile – have become useless if you want to have any detailed information. If you want to get a lot of ads shown to you, you’re in luck.
Today I got some moving crates from a self storage place down the road and gave them to my partner. She texted me a few hours later that it isn’t obvious how to fold them, and I smugly went to the web to help her. I challenge you right now to find a tutorial on how to fold a Shurgard moving crate. I got lots of ideas where I can find self storage in my neighbourhood. I also know all about their services, but there is no place where it states how the hell you fold their specific moving crates.
In the web of old, there is a good chance I would have found some unknown person’s blog post or even Geocities page that proudly showed how to do that. These days, an avalanche of ads and videos that show how to do that with other crates buried that knowledge. And that’s beside it being specific enough to warrant an entry on the Shurgard web site.
Welcome to the content rat race
The main problem I see is that the early investment in the web isn’t a thing any longer. We don’t create content for the web and for longevity. We create content to show ads around it. Consumption has gone down from minutes to seconds. Addiction machines like Facebook, Instagram and TikTok are heralded as the way to go.
Where in the past the number of visitors was interesting and backlinks we all got brainwashed by apps and walled gardens that stickiness and duration of usage is the most important thing.
In my TedX talk 8 years ago I talked about that and explained how apps are a huge step back in software distribution.
I likened apps to Tamagotchi that keep pestering us to feed them but won’t even die if we don’t. Moving on to now, this is what every web site has become. Probably in a senseless attempt to beat apps and the Facebooks, Amazons and Video consumption platforms out there.
Want proof? I worked on a lot of progressive web apps functionality over the years and believe that there is a middle ground of canned application and web site. And when it comes to demands from publishers of PWAs, there is not much about access to hardware or clever new web APIs. The biggest demand was about notifications and making sure people stay in the app or keep coming back to it.
That’s what happens to any web site right now. I click an ad for a product I am actually happy to buy. I go to the web site and get asked to allow for notifcations. No, I came here for a certain reason, I don’t want to be your friend. While I am looking at the product I will get a popup to sign up for a newsletter or friends and family program. And that is how you lose me. I don’t care if I save money, I get this from somewhere else where I learn about the product, not get pestered about my future dealings with the store I went to. This is about me as the customer, not about you and your monthly active user numbers.
Even worse are image results. I love that search engines allow me to look for images and even filter by licence and many other features. I loathe that 90% of image results are pointing to walled gardens that ask me to sign up before seeing it. I really wished search engines would not show me Facebook or Pinterest results unless I am also logged in there.
I miss the web
I miss having the web as a resource. As a library of knowledge and a collection of weird and wonderful entertainment and subculture art. When the web came out it was revolutionary and challenged TV and radio. I didn’t have to wait for a certain time to learn about a new movie – I could read up on it any time I wanted. I could read from other people what they thought of it, instead of having paid influencers with pre-fed soundbites tell me why it is sooooo amazing.
The problem is that search engine results – especially on mobile – are not how you find that any longer.
Curated link collections to the rescue?
One thing that didn’t change as much over the years and has quite a renaissance right now are curated link collections. In the past these were social bookmarking sites with delicious being the big player there until Yahoo axed it because it had its own bookmarks product. These days I personally use Pinboard.in to record all the links I tweet about. I also use Feedly to read RSS feeds and most of what I post in social media came from there. Both are products that allow me to curate my findings, share it with people and follow others. Much like the web used to be in the past.
Testing for accessibility is an incredibly important part of your development process. Products that don’t block out users because of easy to avoid issues have more success. And the longer you wait with fixing accessibility problems, the harder it gets. That’s why it is annoying when it is hard to find out about accessibility problems.
Tooling in the accessibility space has gone leaps and bounds in the last years. Screenreaders, high contrast modes and other assistive tools are part of the operating systems. Most even come with in-built tutorials to get you started.
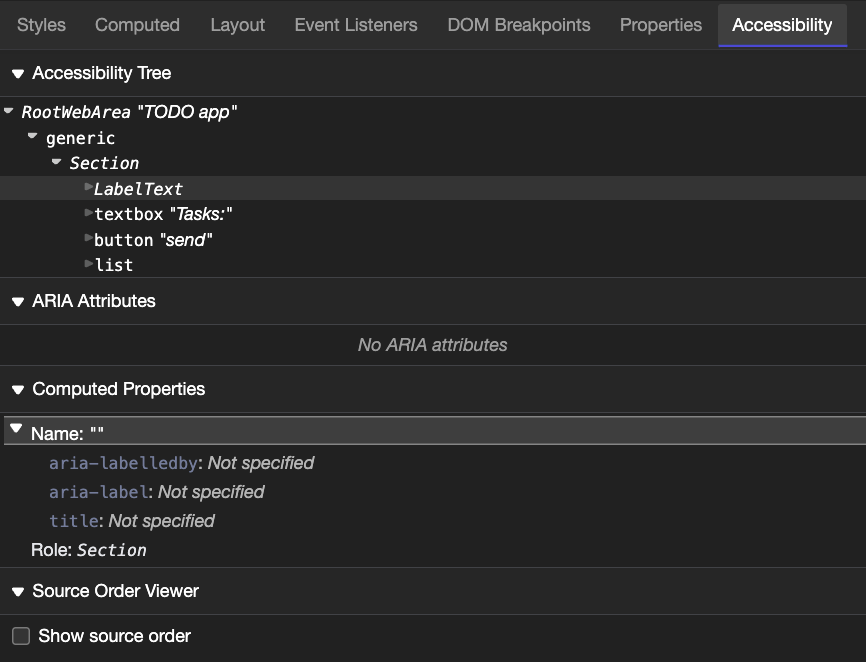
In the browser tooling space a lot of tutorials on accessibility testing send you to an “Accessibility tab”. This is a display of the Accessibility tree and unless you are already in the know, feels rudimentary and daunting. For people who know what to look for, it is exactly what they need, but it feels like a wasted opportunity to get people into accessibility testing.
I don’t think accessibility tooling should be exclusive to accessibility experts. Accessibility is an integral part of any product. That’s why accessibility problem reporting should happen where people develop products.
Accessibility information in the Inspector overlay
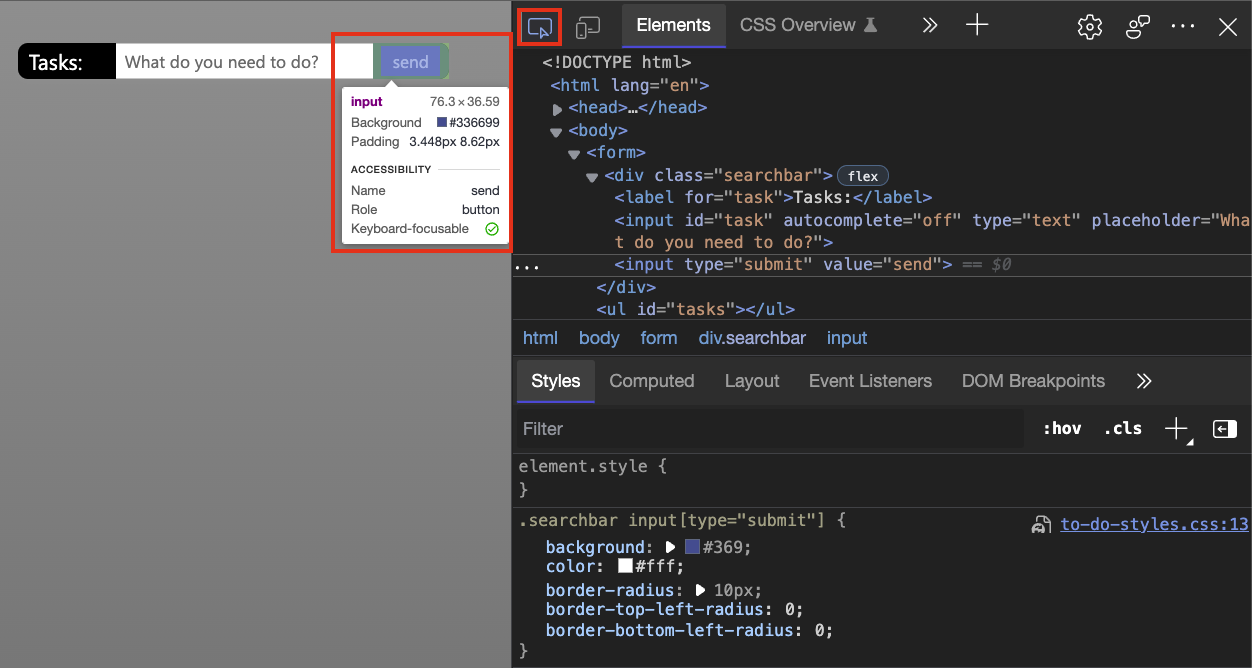
The Inspector tool allows you to move your mouse around the document and find out a lot about each element. The on-screen overlay shows you:
How the element is positioned (flexbox or grid showing as an appropriate icon)
The name of the element, such as a, h1, or div.
The dimensions of the element, in pixels.
The colour, as a colour swatch and a formatted value.
Font information (size and font families).
Margin and padding, in pixels.
The contrast of the element and if it is enough (checkbox) or an accessibility problem (exclamation mark)
The name and the role of the element in the accessibility tree
If the element is keyboard focusable (checkbox) or not (circle with line through it)
That’s a lot more actionable information than the Accessibility tool gives you and you can immediately act on it inside the Elements tool. A button that isn’t keyboard accessible is broken, and you find it out by inspecting it. A DIV disguised as a button without keyboard functionality won’t even show up in the accessibility tree, which also means that it is broken, but you wouldn’t know about it.
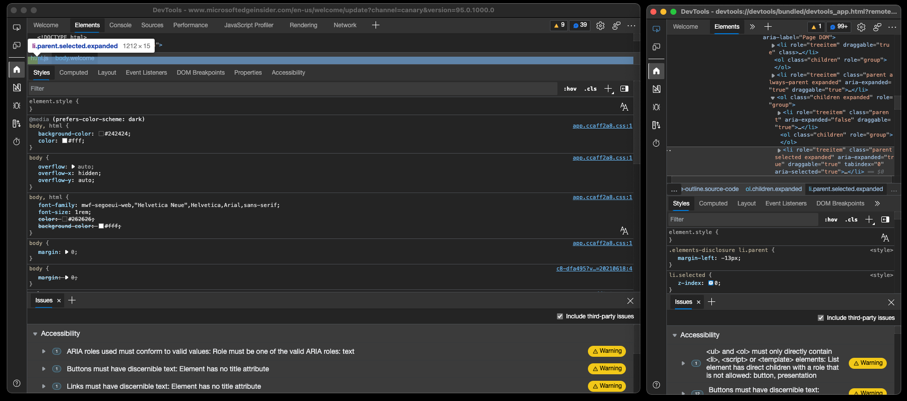
Issue reporting in the Elements tool source code
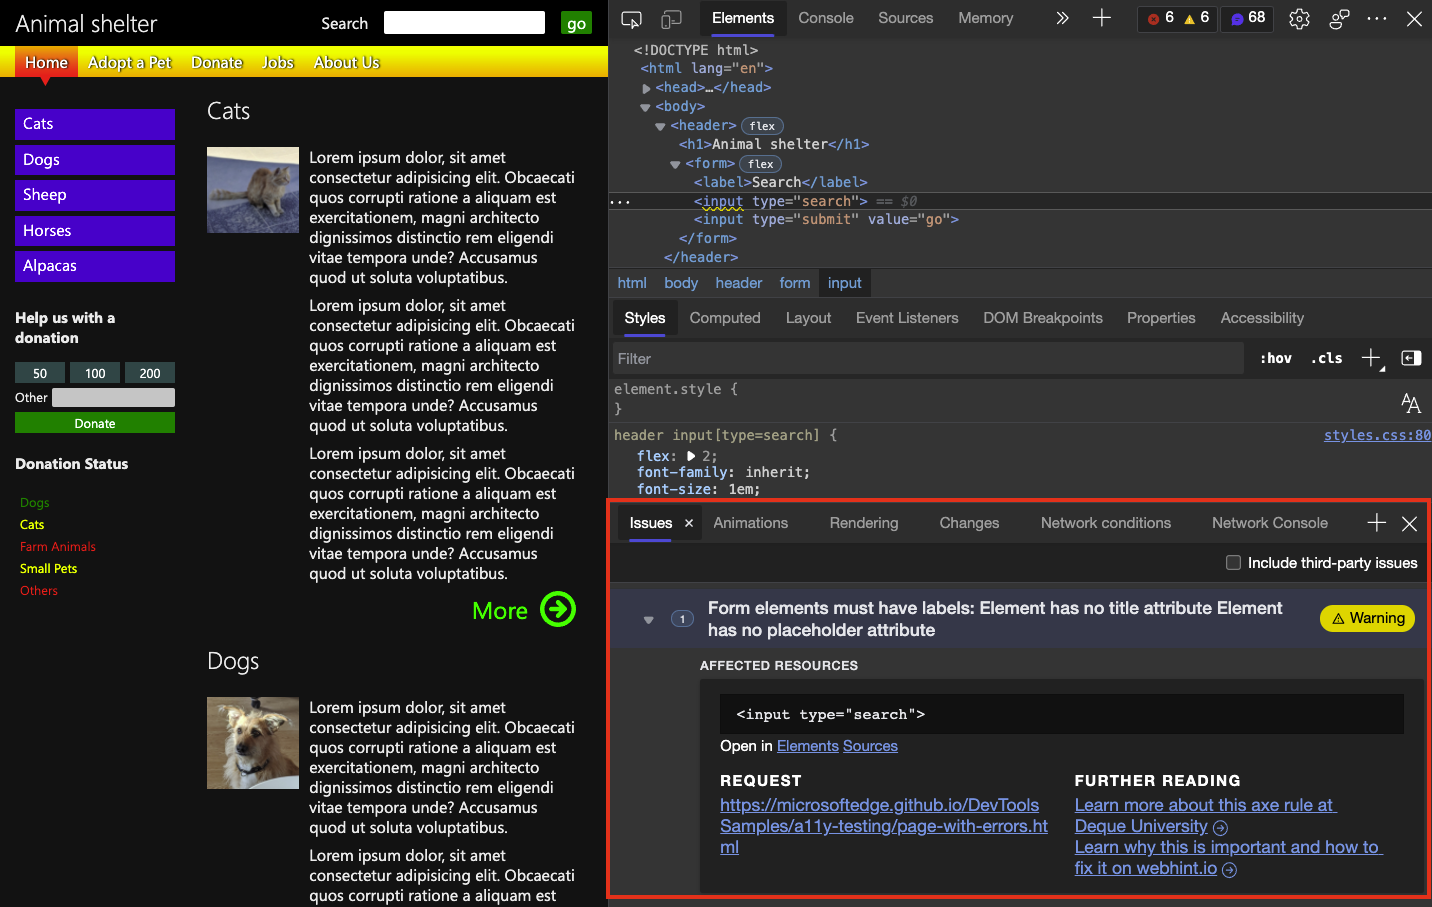
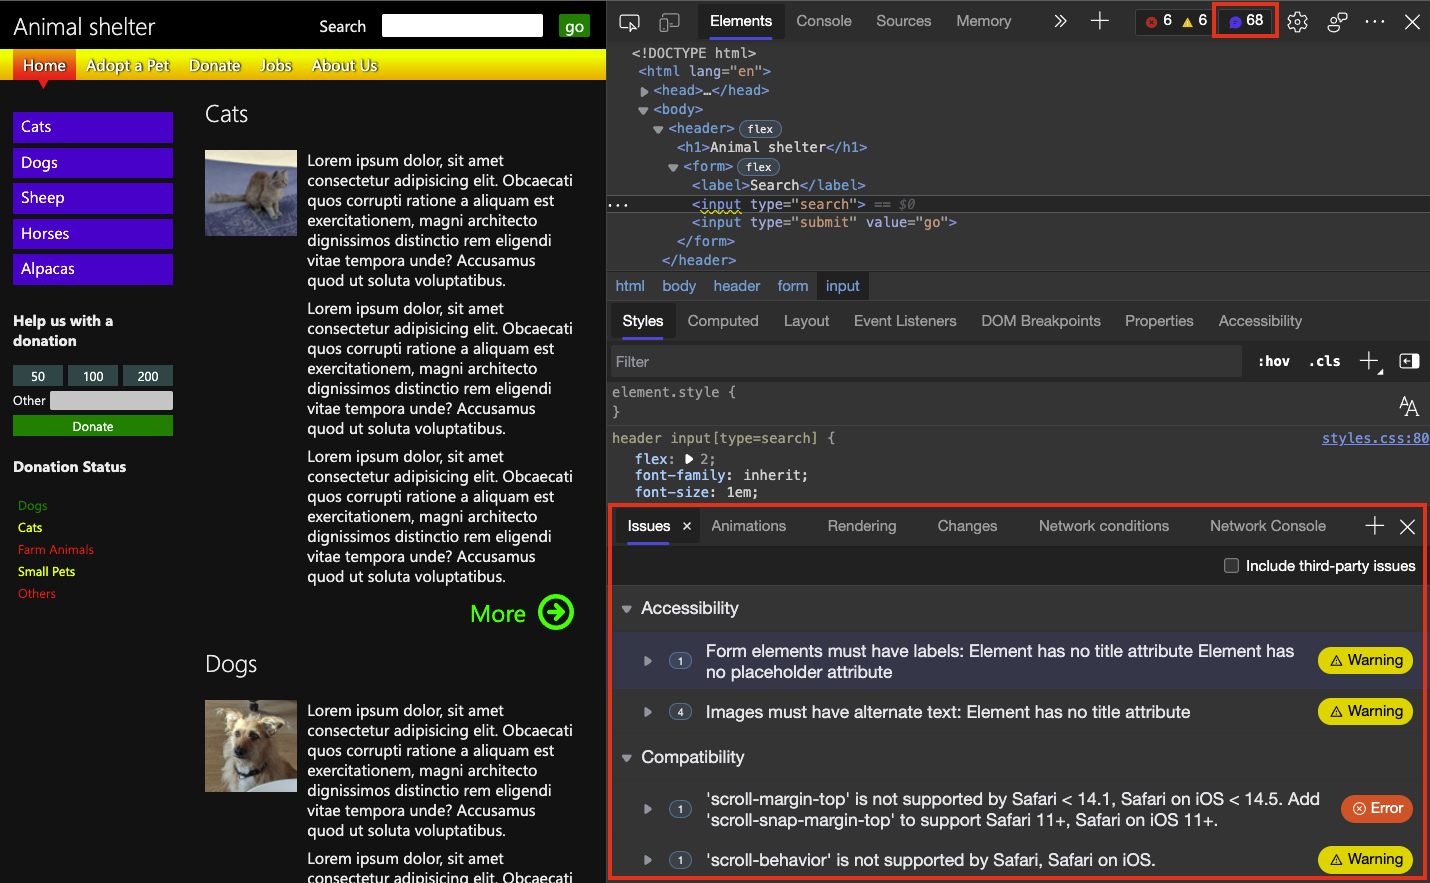
The Elements tool highlights HTML elements with issues (accessibility or browser compatibility) by showing a wavy underline.
When you shift-click these, you get to the Issues tool that describes the problem and explains how to fix it with “Further reading” links, although the issue report should be self-explanatory.
You can also always go to the Issues tool directly clicking the issues counter in DevTools.
Live issue reporting in Visual Studio Code
These are all reporting tools that kick in after you deployed your product. If you use the Edge Tools for Visual Studio Code extension, you get the reporting as you write your code. If you – for example – add an image without an alternative text alt attribute, Visual Studio code rightfully adds a wavy underline and explains to you that you should add one.
You can see this feature in the following video on YouTube:
Let’s meet developers where they are and show them what needs fixing
Developers are busy people and we hope that by bringing accessibility information right to the tools they already use we get people to embrace the issue more.
Interfaces on the web have to be accessible independent of input device. In addition to using the right HTML to make it possible to activate functionality with mouse, keyboard, voice activation or any of the possible ways it is also important to have a visual indicator which element is currently active.
This is why we should always define at least hover and focus states to help our users in their journey. The problem is that styling these states can be daunting, as you need to interact with the element to see the different states like hovering over it with a mouse or using the `tab` key to highlight it with your keyboard and trigger the `focus` state.
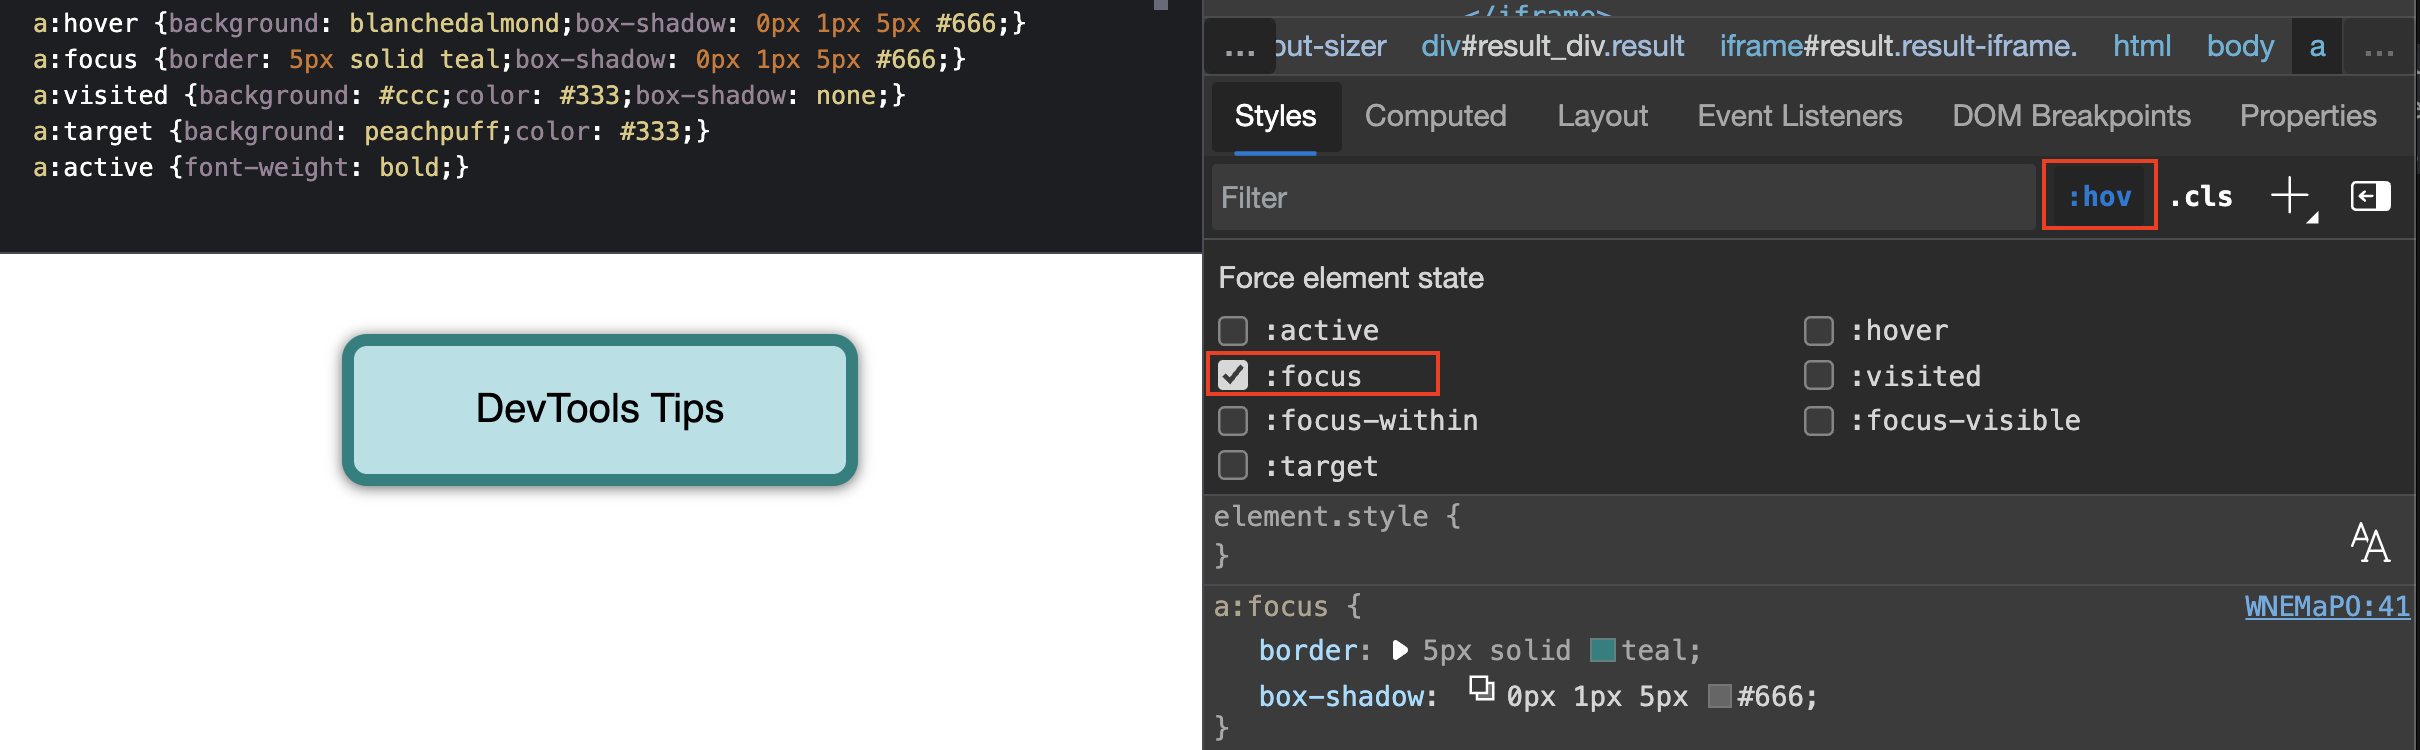
That’s why it is great that browser developer tools allow you to simulate these states, which means you can quickly test all the possibilities without having to interact with the elements. You do that in Chrome, Edge or Safari in the Elements panel and Firefox has this functionality as part of the Rules panel. When you activate the `:hov` button you get a group of checkboxes to simulate different states.
In the following screencast you can see how to use state simulation to check the hover, active, visited and focused state of a link without interacting with it. If you want to try it out yourself, [here is the demo page](https://codepen.io/codepo8/pen/WNEMaPO).
Posted in General | Comments Off on Quick browser Developer Tools tip: define and test interaction states in CSS using state simulation
Update: As this is blowing up on Hackernews I added information to each of the tips in which environment they are supported in parenthesis after each heading. When I state “Chromium browsers”, this refers to all browsers that use the Chromium core and also feature all the Developer Tools. This is Chrome, Microsoft Edge, Brave and many more. As a reminder: Microsoft Edge is the browser that comes with Windows 10/11 and is based on Chromium and thus from a platform perspective simular to Chrome. They differ in UX and services around the core. Edge Developer Tools work closely with Google on bringing the work we add to the product back into the Chromium Core. But some of the things I am talking about here are experiments and exclusively in Microsoft Edge, which is available on Windows, Mac and Linux. Some functionality is only available inside Visual Studio Code via the Edge DevTools for VS Code extension .
This is a talk that I’ve given at CityJS this September. I am a principal product manager for developer tools in Microsoft Edge and these are things I encountered during working on the tools, documenting them and going through user feedback.
1. Console is much more than `log()`!
(All browsers with developer tools following the standard)
There is no doubt that, besides the Elements tool, Console is the most used part of the browser developer tools. Specificially, people love to debug by putting a `console.log()` in their code to learn what’s going on. There are a few problems with that, and there are better ways to debug scripts, but as this is what people do, let’s talk how to make that experience better.
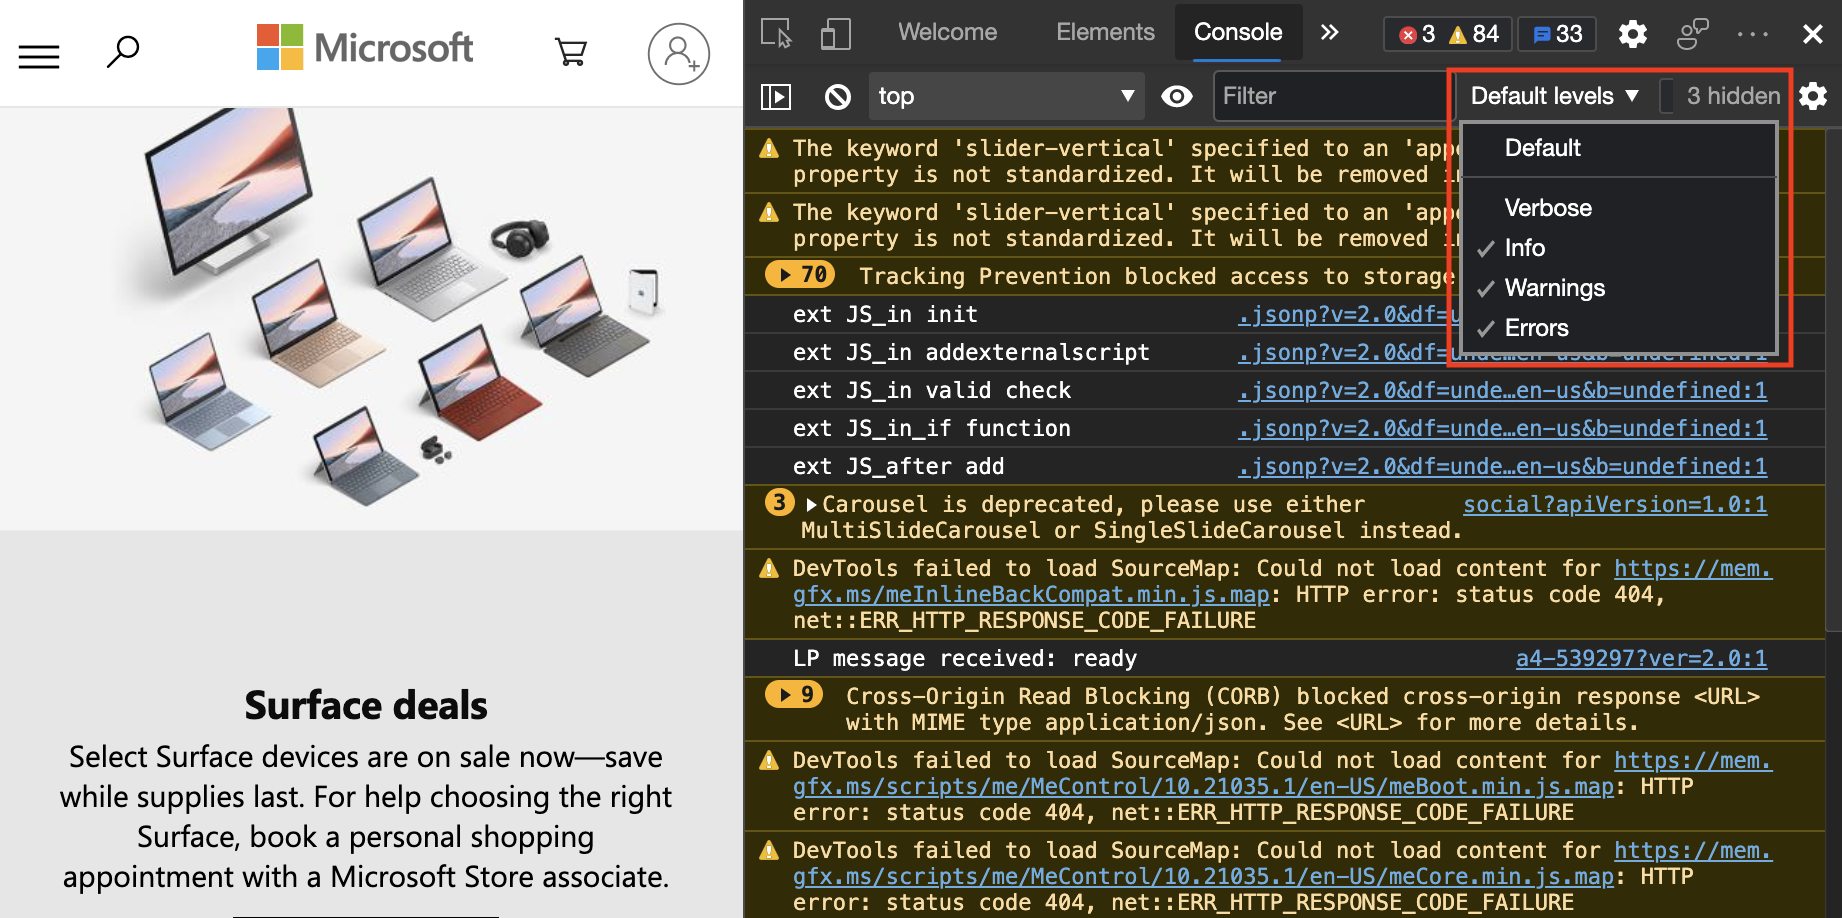
The first problem is log messages that aren’t removed when a product goes live clogging up the Console. Finding the information you’re looking for becomes daunting and the best way to work with that is to learn about the console filtering options available to you . Using these you can filter the reporting of the console to the things you care about and block out a lot of the noise.
What is that you’re logging?
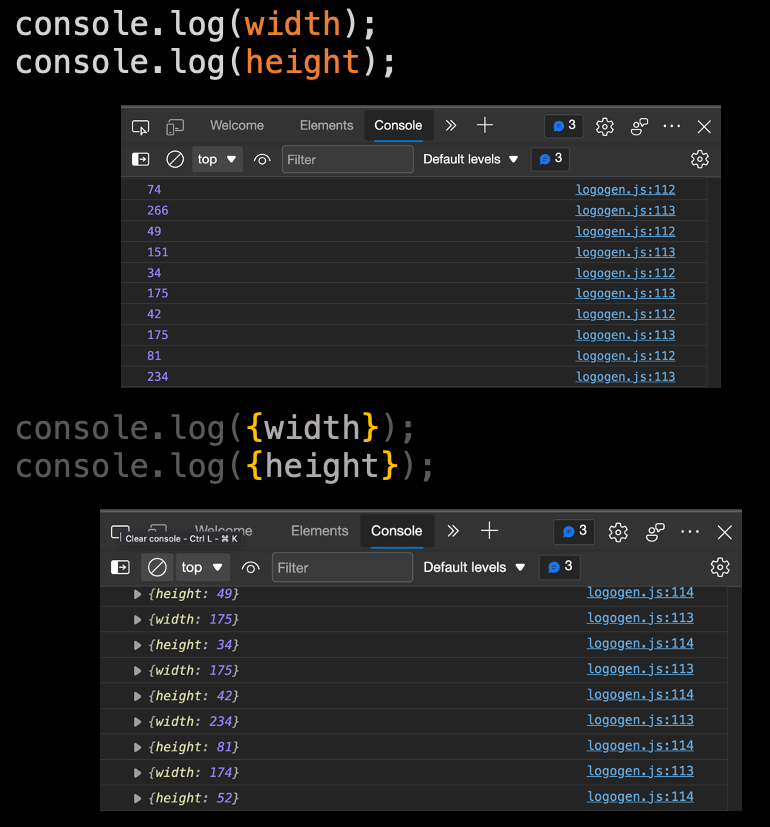
The next problem with using `console.log()` is that we seem to only log values and forget to add where they come from. For example, when you use the following code, you get a list of numbers, but you don’t know what is what.
console.log(width)
console.log(height)
console.log(width)
console.log(height)
The easiest way to work around that issue is to wrap the things you want to log in curly braces. The console then logs both the name and the value of what you want to know about.
console.log({width})
console.log({height})
console.log({width})
console.log({height})
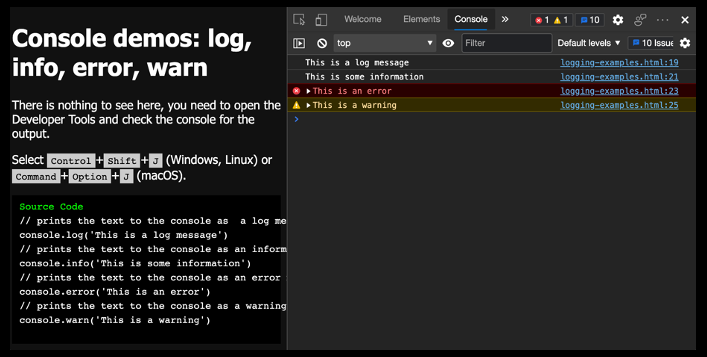
Adding to your console vocabulary
In addition to `console.log()` you have a lot more methods you can use . For example, `console.warn()` logs a warning, `console.info()` an informational message, and `console.error()` an error message. This not only results in slighty different displays in the console, but it also gives your messages a different log level, which means it is easier to filter for them.
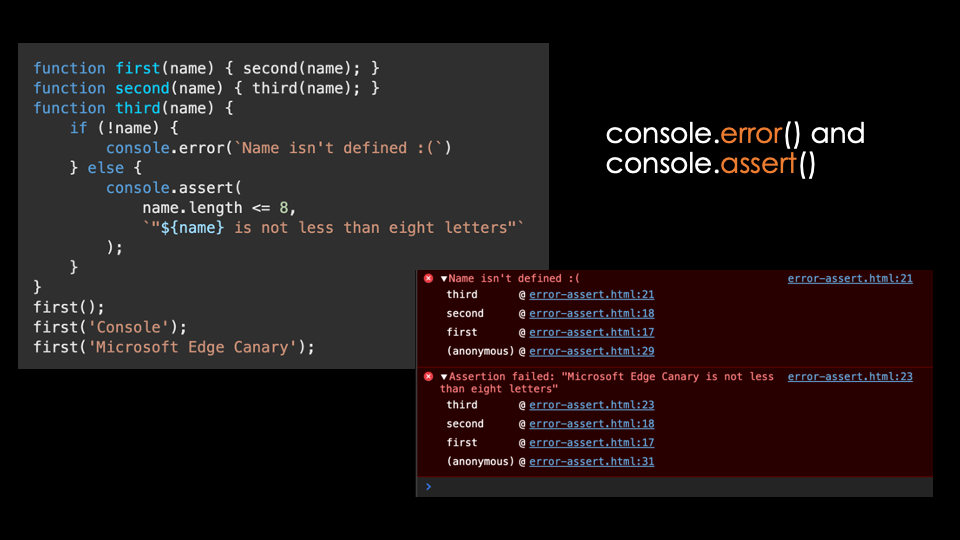
Errors and assertions in Console
Displaying an error in the console is different to throwing an error, but it still is a good idea to show the severity of an issue to the person maintaining or debugging the product. Another interesting method is `console.assert()`, which only logs a message when a certain condition is met. Often you find yourself writing an `if` statement with a `console.log()` inside. Using `assert()` makes that one redundant and you have one less thing to worry about when cleaning up your debugging code.
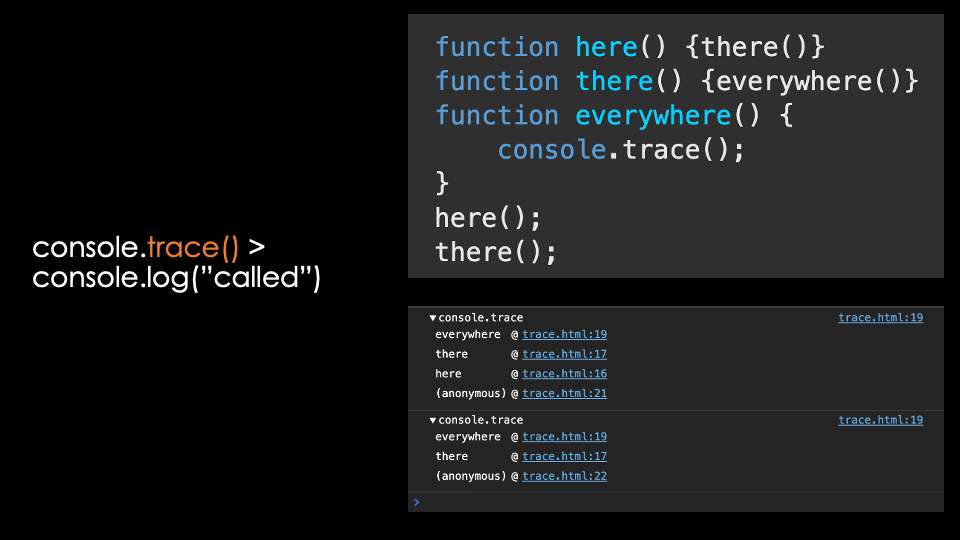
Tracing where something came from
Often you find yourself adding a `console.log(‘called’)` or similar to test if a certain functionality is even triggered. Once you have that the next thing you normally want to find out what called that method. That’s what `console.trace()` is for, as it doesn’t only tell you that something was called, but also where the call came from.
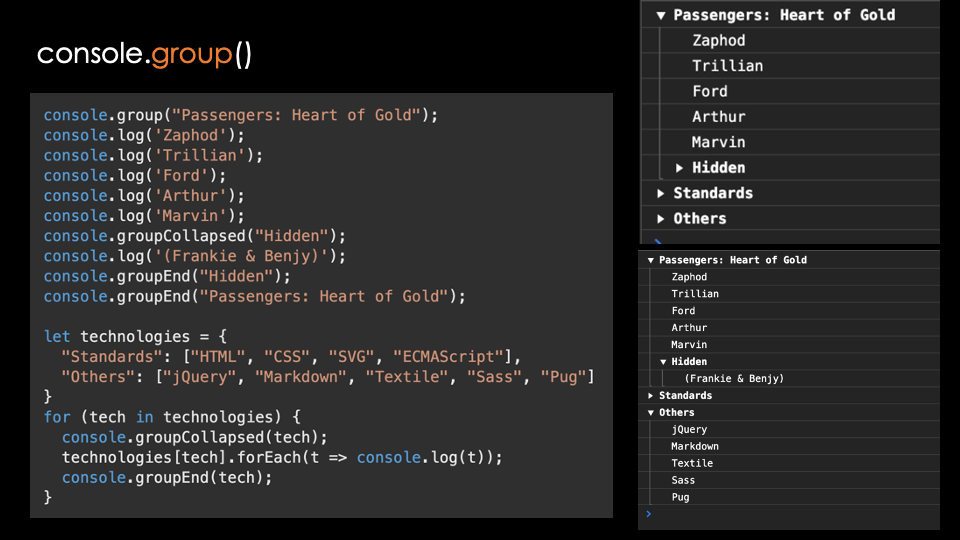
Grouping console messages
If you have a lot to log, you can use `console.group(‘name’)` and `console.groupEnd(‘name’)` to wrap the messages in collapsible and expandable messages in the Console. You can even define if the groups should be expanded or collapsed by default.
Displaying and filtering lots of information in the console as tables
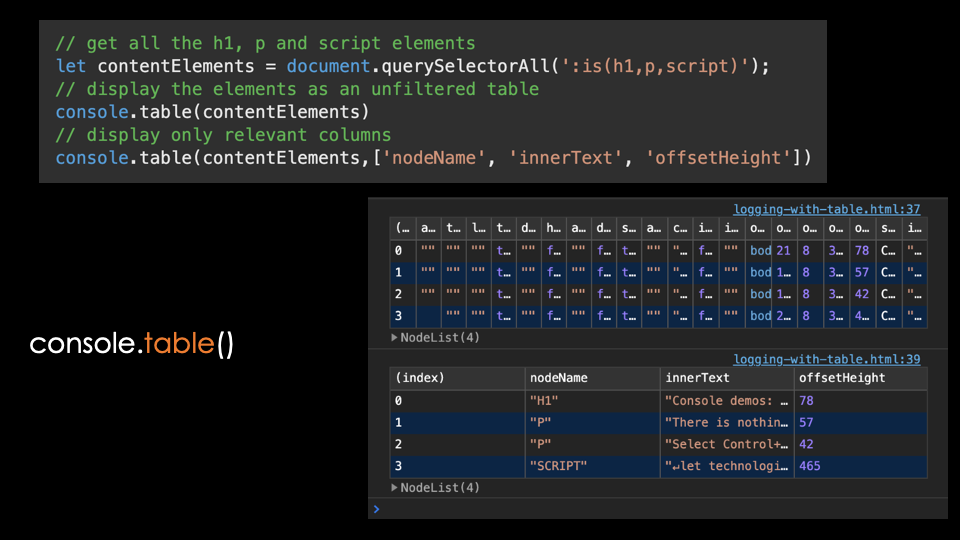
If you want to display a lot of of information as a log, it can become daunting to read the information. The `console.table()` method displays array-like data as a table in the console, and you can filter what you want to display by giving it an array of the properties you want to see.
For example, you can use `let elms = document.querySelectorAll(‘:is(h1,p,script’)` to get all H1, paragraph and script elements from the document and `console.table(elms)` to display this information as a table. As the different elements have a boatload of attributes and properties, the resulting table is pretty unreadable. If you filter down to what you are interested in by using `console.table(elms,[‘nodeName’, ‘innerText’, ‘offsetHeight’])` you get a table with only these properties and their values.
The table structure is maintained when you copy and paste this information, which makes it a wonderful tool to get data into Excel or Word, for example.
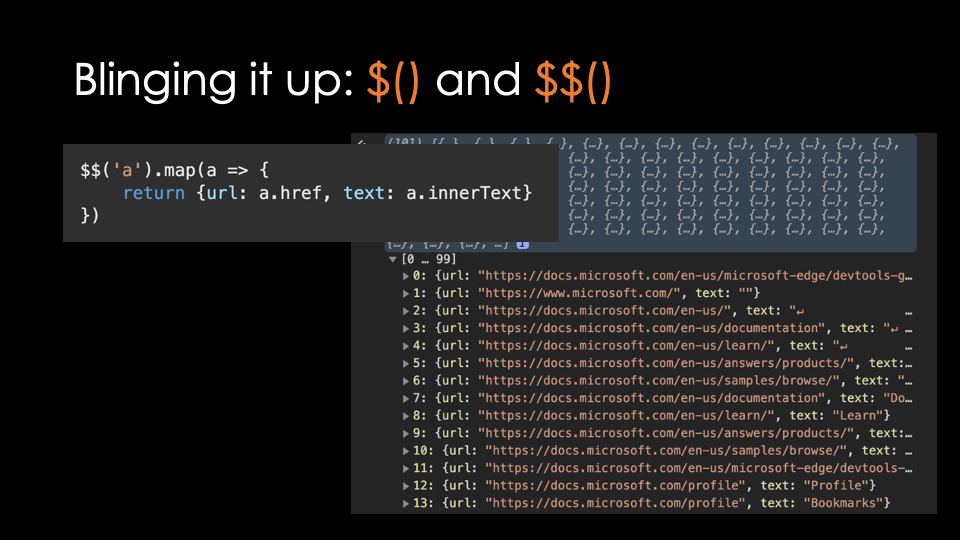
Blinging it up: $() and $$()
The console comes with a lot of convenience methods you can use called the Console Utilities . Two very useful ones are `$()` and `$$()` which are replacements for `document.querySelector()` and `document.querySelectorAll()` respectively. These not only return the nodeList you expect, but also cast the results to arrays, which means you can use `map()` and `filter()` on the results directly. The following code would grab all the links of the current document and return an Array with objects that contain only the `href` and `innerText` properties of each link as `url` and `text` properties.
2. You can log without source access – live expressions and logpoints
(Chromium browsers)
The normal way to add a `console.log()` is to put it inside your code at the place you want to get the information. But you can also get insights into code you can’t access and change. Live expressions are a great way to log information without changing your code. They are also incredible to log values that change constantly without flooding the console and thus slowing down your product. You can see the difference in the following screencast:
Logpoints are a special kind of breakpoint. You can right-click any line in a JavaScript in the Sources tool of the Developer Tools and set a logpoint. You get asked to provide an expression you’d like to log and will get its value in the console when the line of code is executed. This means you can technically inject a `console.log()` anywhere on the web. I wrote about logpoints back in August and you can see a demo in the following screencast:
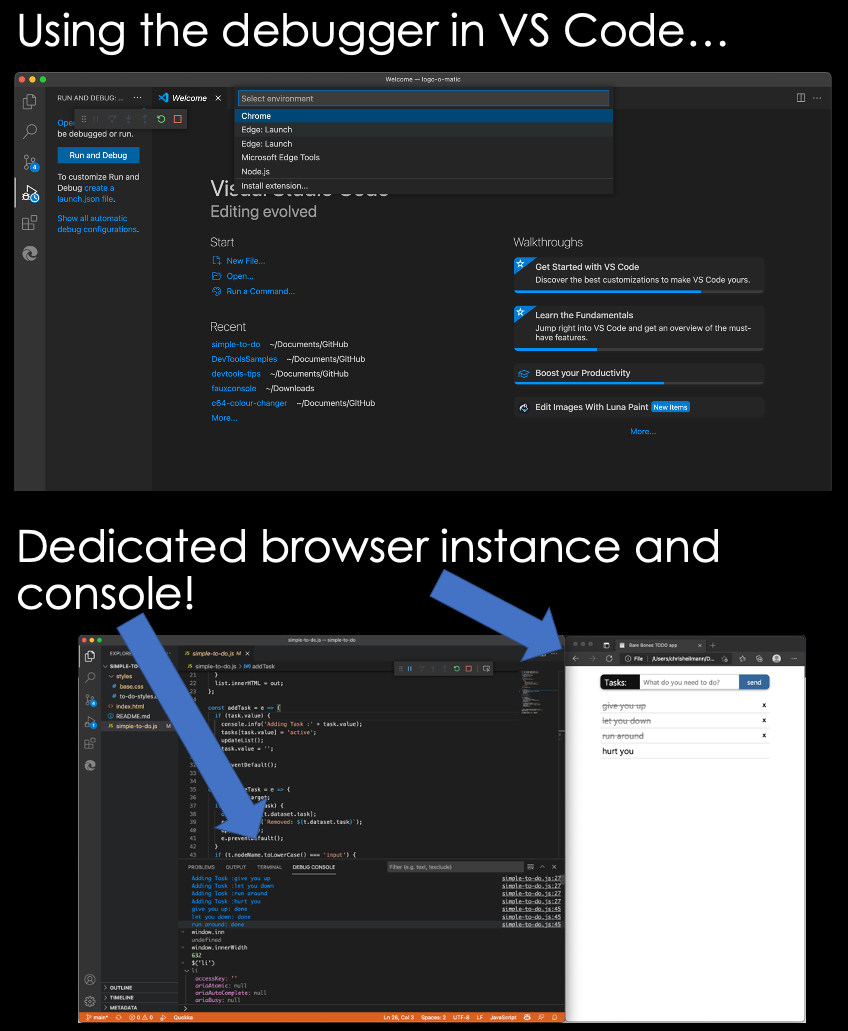
3. You can log outside the browser – VS Code debugger
(Chromium Browsers and VS Code)
When you start a debugging session in Visual Studio Code, you can spawn a browser instance and the Debug Console becomes the Console you are used to from the browser developer tools. I blogged about this in July in detail, so you can read up there how to do that . There is also more in the official documentation.
You can also watch this one minute video of me showing the functionality:
4. You can inject code into any site – snippets and overrides.
(Chromium Browsers)
Snippets are a way in Developer Tools to run a script against the current web site. You can use the Console Utilities in these scripts and it is a great way to write and store complex DOM manipulation scripts you normally execute in the Console. You can run your scripts in the window context of the current document either from the snippets editor or from the command menu. In the latter case, start your command with an ! and type the name of the snippet you want to run.
Overrides allow you to store local copies of remote scripts and override them when the page loads. This is great if you have, for example, a slow build process for your whole application and you want to try something out. It is also a great tool to replace annoying scripts from third party web sites without having to use a browser extension.
5. You can inspect and debug much more than you know!
(Chromium Browsers)
You may know the Chromium developer tools from browsers like Google Chrome, Brave or Microsoft Edge, but they are available in a lot more environments. Any app that’s based on Electron can have them enabled and you can use the Tools to peek under the hood and see how the product was done. This works, for example, in GitHub Desktop, Visual Studio Code, or you can even debug the Developer Tools of the browser using Developer Tools!
If you inspect the Developer Tools, you will see that they are written in HTML, CSS and TypeScript. It is an exciting environment to use these technologies, as you you know the rendering engine your code will run in – something you never know on the web.
Edge Developer Tools in Visual Studio Code
(Microsoft Edge via a VS Code extension)
The embeddable nature of the tools also allowed us to offer you a way to use them outside the browser. The Microsoft Edge Tools for Visual Studio Code extension brings the tools to Visual Studio Code. That way you can use the visual debugging tools right next to your code editor and you don’t need to jump between the two all the time.This also ties in with the “Console in Visual Studio Code” trick mentioned earlier. When you start a debugging session and you click the Developer Tools icon, the tools will open or – the first time – you will be prompted to install the extension.
6. Some dirty secrets…
Working intimately with developer tools and getting feedback and usage information taught me a few dirty secrets. The first one is that whilst we are all super excited about all the amazing features of developer tools, users only use a very small percentage of them. Many things heralded as the best thing since sliced bread in presentations and video tutorials are hardly every opened, let alone used. I thought this was about a lack of documentation and we spent a massive amount of time to update the DevTools documentation to ensure everything in them is described and explained, but that wasn’t it. Documentation is something people seem to go to as a last resort when they are stuck and Google/Stack Overflow/Social channels didn’t yield any results.
Developer tools have become complex and are overwhelming – a few ideas how to fix that
(Microsoft Edge)
It might be that the plain fact is that the Developer Tools of browsers grew organically over the years and can be incredibly overwhelming to look at. And that bothers me and I think we should do better. Here’s my mantra when it comes to tools for developers:
Developer tools should not expect people to be experts but turn them into experts over time.
We’re working on a few ideas to make that easier, and you will soon see those in Microsoft Edge. One idea we had is a “Focus Mode”. Instead of showing you all the tools and tabs we sorted the tools into different use cases, like “Elements/CSS debugging”, “Sources/JavaScript Debugging” or “Network inspection”. We then show only the relevant tools and hide all the ones that may be confusing or in the way.
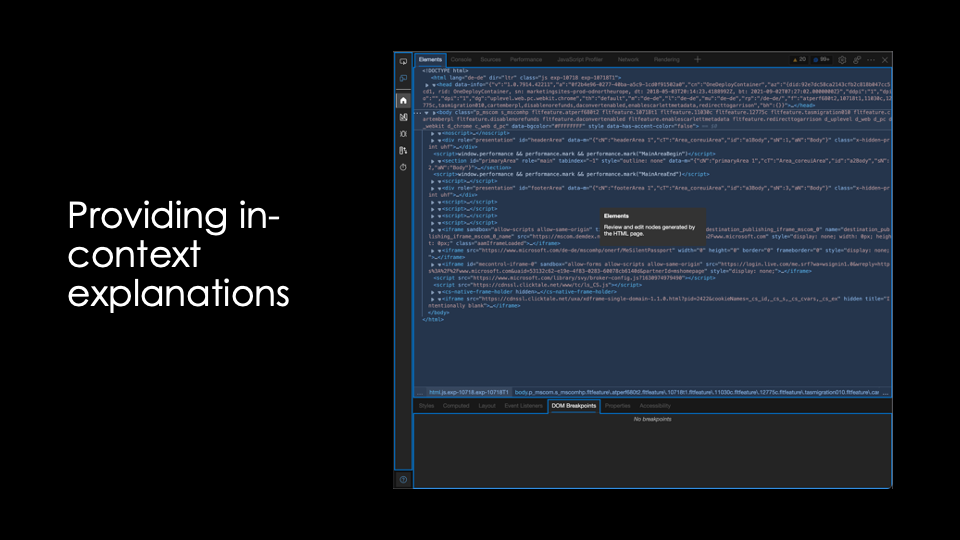
Another feature we are working on are “informational overlays”. You get a help button that allows you to turn on overlays for the developer tools, explaining what each of the tools is, how to use it and providing links to the documentation. We hope that this would make it easier for people to learn about more features.
There is still a disconnect between authoring code and debugging the outcome
(Microsoft Edge)
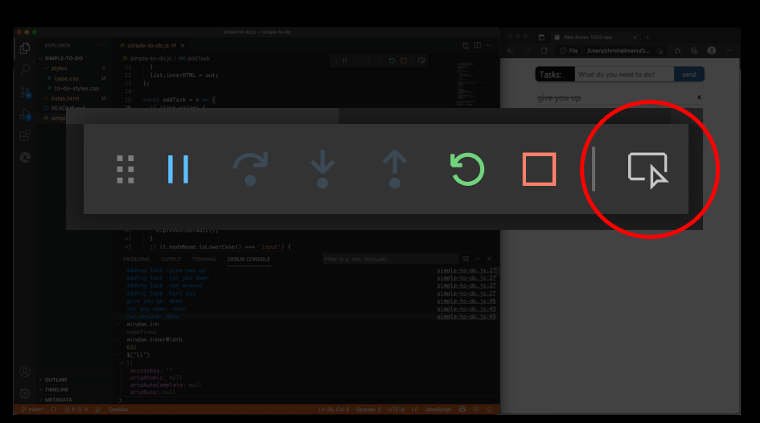
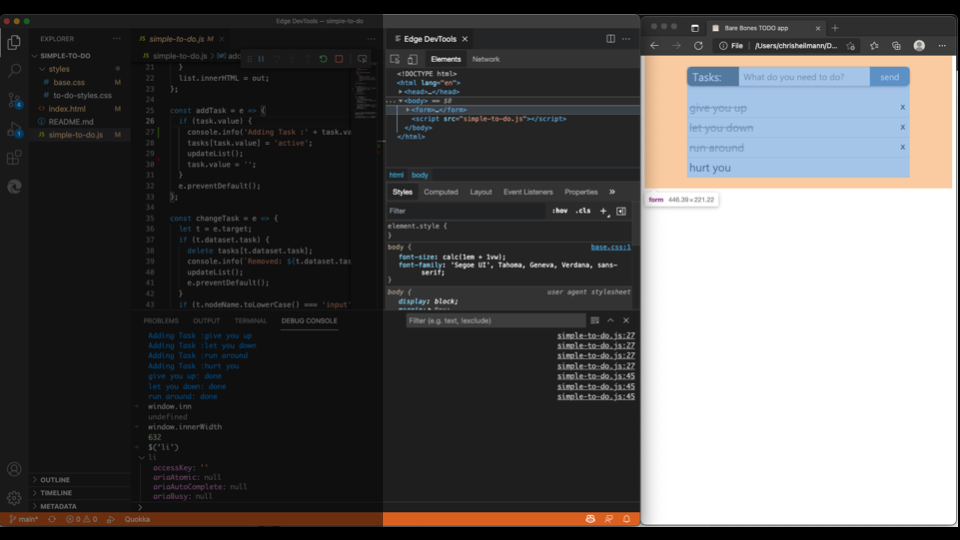
Whilst it is amazing what tools provide us these days there is still a disconnect between authoring and debugging. Most of the time we write our code, create the app and then go to the browser to see what doesn’t work. We then use the browser developer tools to tweak and fix these issues. And then comes the big issue we still need to fix: how do you get the changes you created using the browser developer tools back into your code? Most of the time, the answer is “copy and paste or try to remember what needs changing”.
We’re currently working on two ways to make this easier. One is to replace the in-devtools editor with Visual Studio Code when it is available and to change files on the hard drive as you use the browser developer tools. The other is part of the VS Code extension and changes the source code in the editor as you use the developer tools but still gives you the final say in changing the file on disk. I described the problem and the possible solutions on the Edge blog or you can watch the following two screencasts to see them in action.
CSS Mirroring in Visual Studio Code:
What if… Visual Studio Code became the editor of in-browser Developer Tools?
7. You’re the audience and the clients of Developer Tools!
(Applies to all browsers, but channels shown here are Microsoft Edge only)
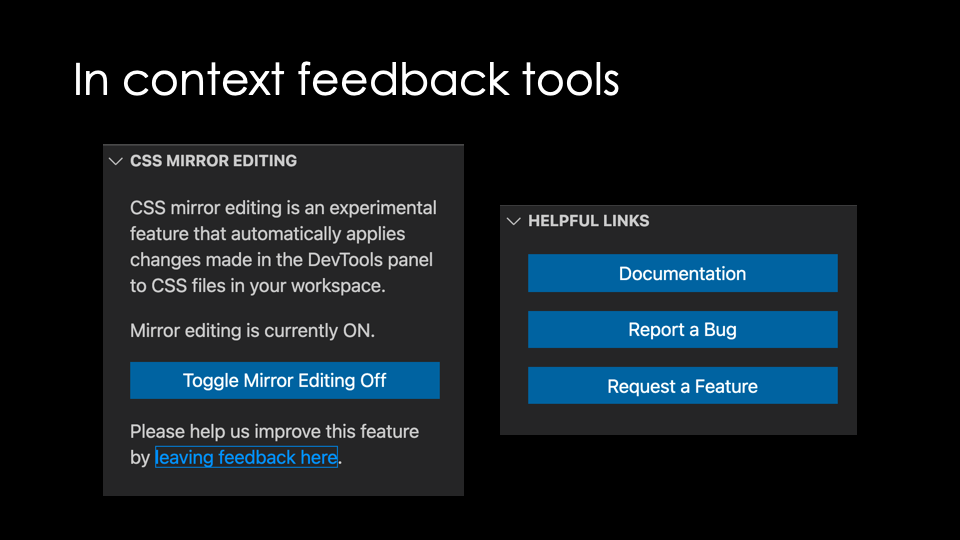
As a developer, you are the main audience for Developer Tools. We are open to your feedback and many of the recent changes to the tools are direct results from demands from outside developers. We try to make this as easy as possible by providing in-context ways to contact us directly. For example, the Visual Studio Code extension has prominent links and buttons for you to report issues and request features.
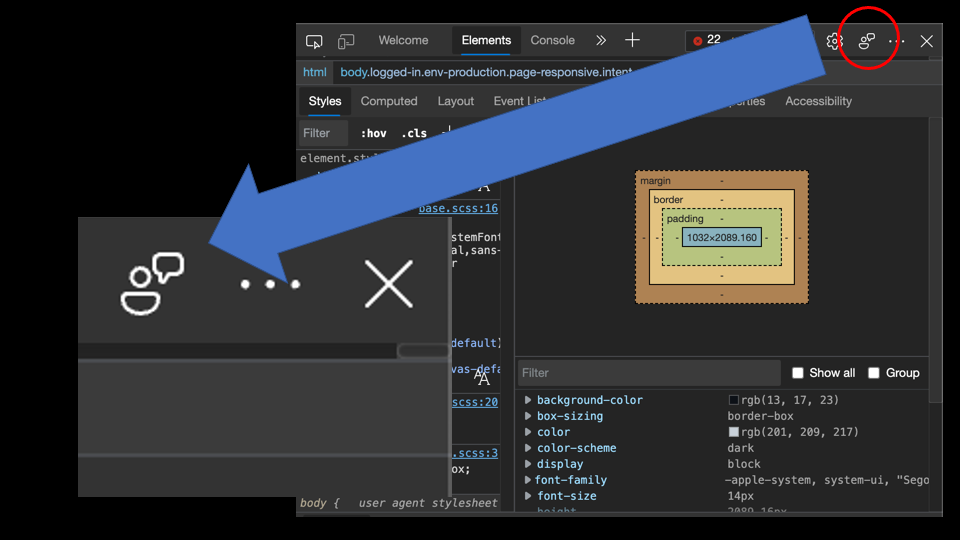
The in-browser developer tools also have a direct button to give us feedback. To make it easier for you to provide actionable feedback, the button includes a lot of automatic information.
It records automatically what URL the issue happened on, takes a screenshot to include and offers to send diagnostic data. We also ask for you to provide an email in case we need more information and you can add attachments and info how to recreate the issue. We check this feedback daily, and a lot of great inventions and bug fixes came from that source.
Posted in General | Comments Off on Developer Tools secrets that shouldn’t be secrets