Using console.log() debugging in Visual Studio Code
Friday, July 30th, 2021 at 11:22 amUsing the new in-built JavaScript debugger in Visual Studio code you can use the browser developer tools Console right inside the editor.
I just published a “TikTok” style video on the official Visual Studio Code channel explaining this and – after lots of criticism for the quality of the video (lads, this is on purpose!) – people had more questions, so here goes.
In the video I use a project I have open with a launch.json file already defined, which means it opens the correct URL for you when you start debugging. You can, however, also do that by hand. And it even works without a local server. So, let’s do this.
Step 1: Create a folder and call it consoledebug
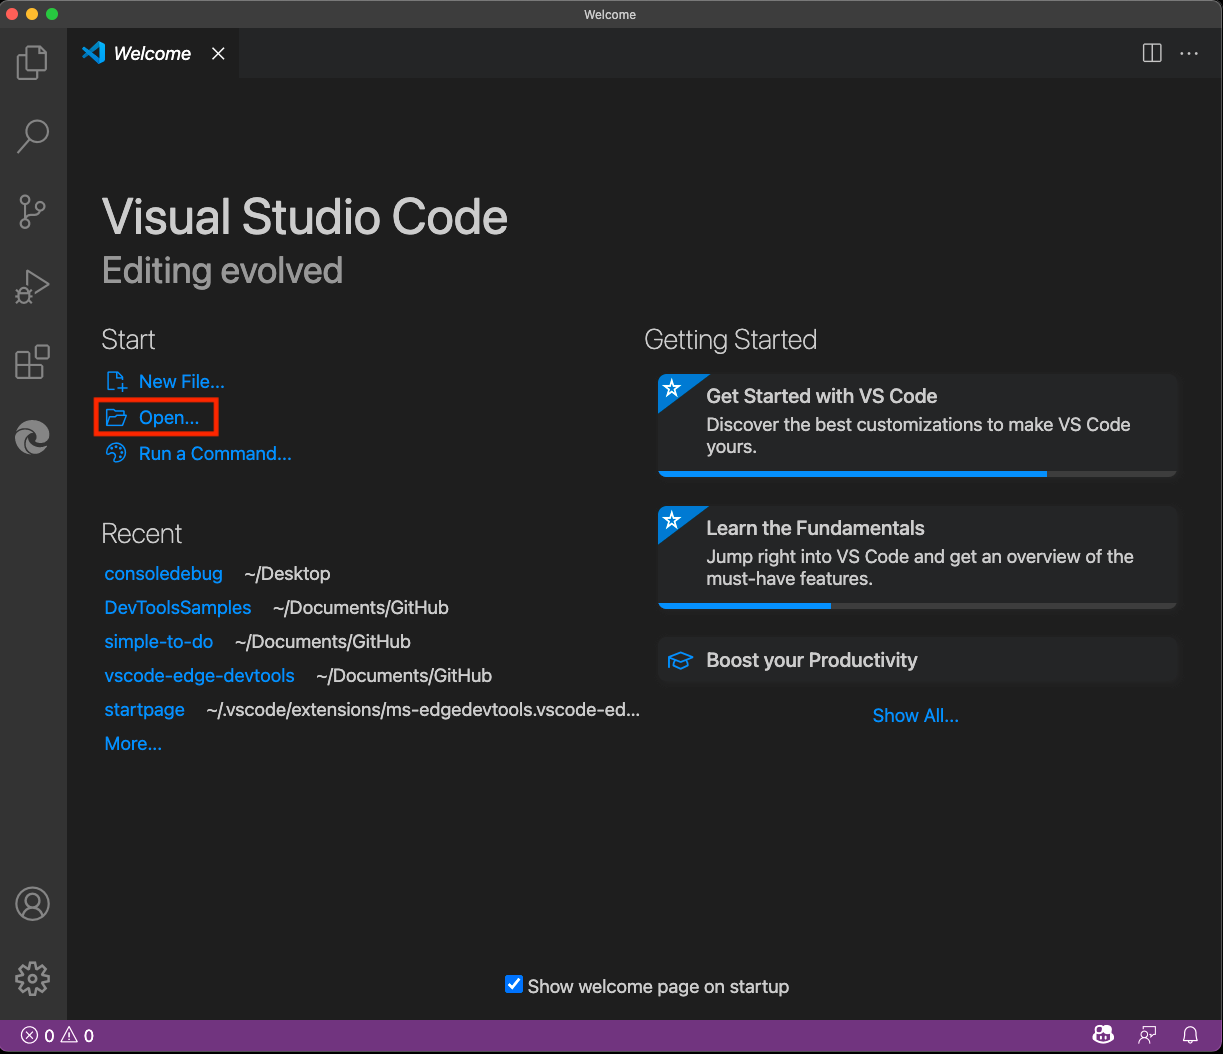
Step 2: Start Visual Studio Code, choose “open” – select that folder
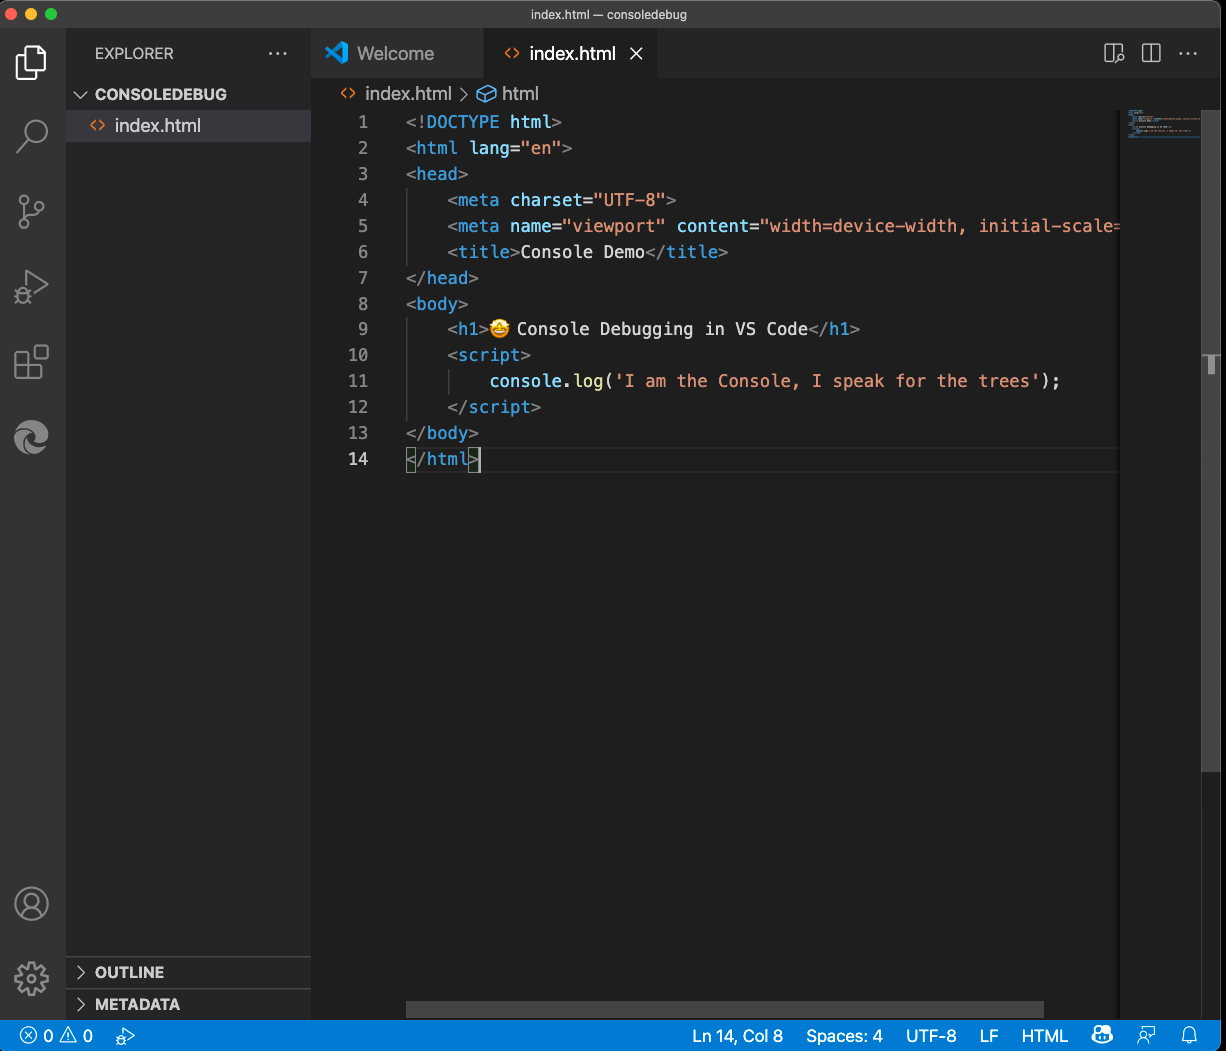
Step 3: Select New File, call it index.html
Step 4: Add some HTML/JS and save it
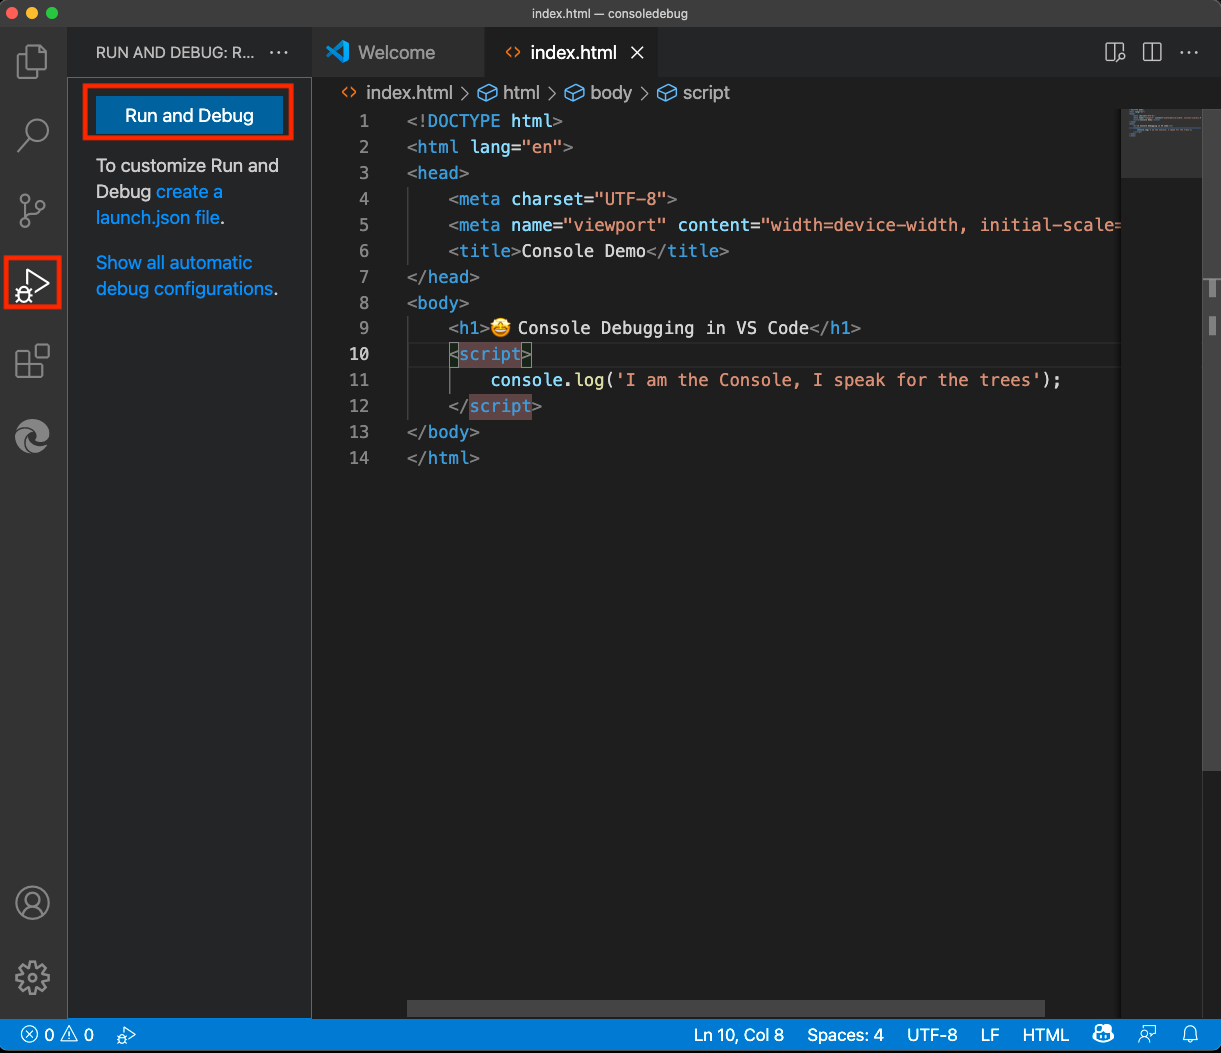
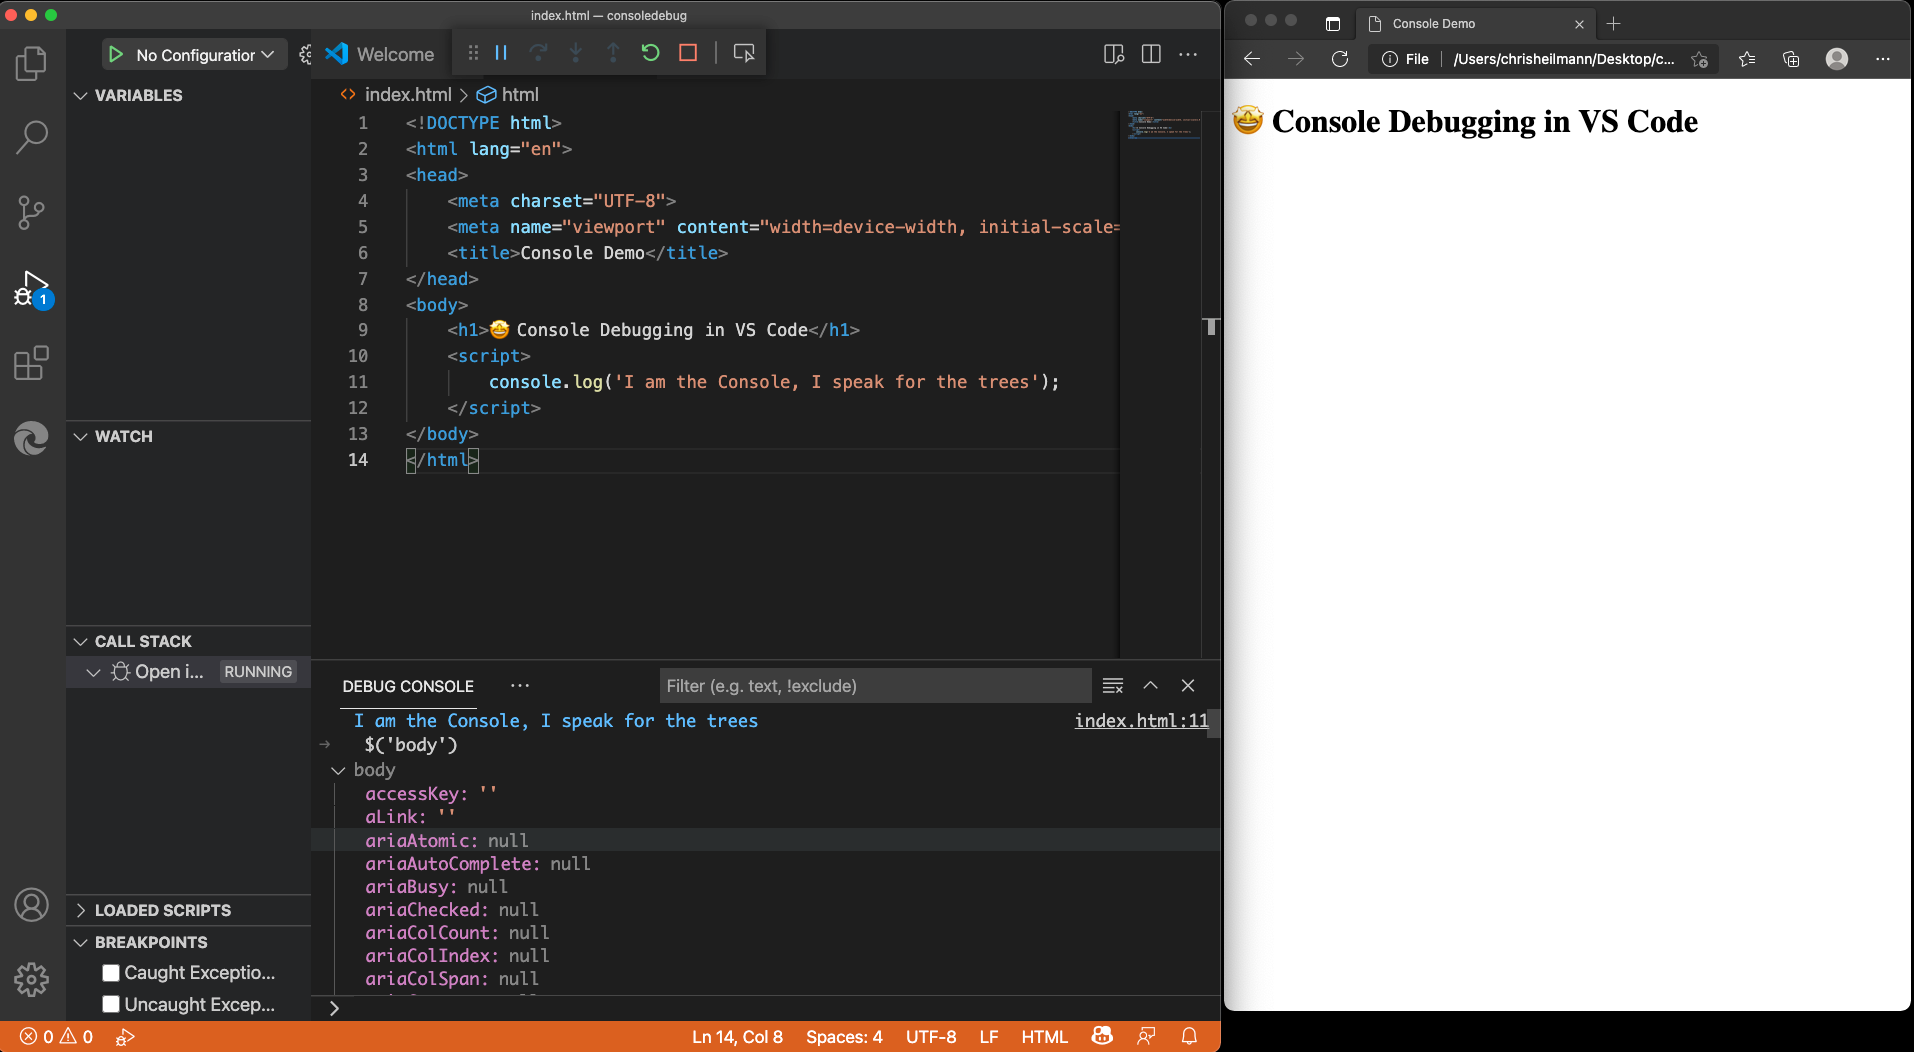
Step 5: Select the “Run and Debug” icon and press the “Run and Debug” button
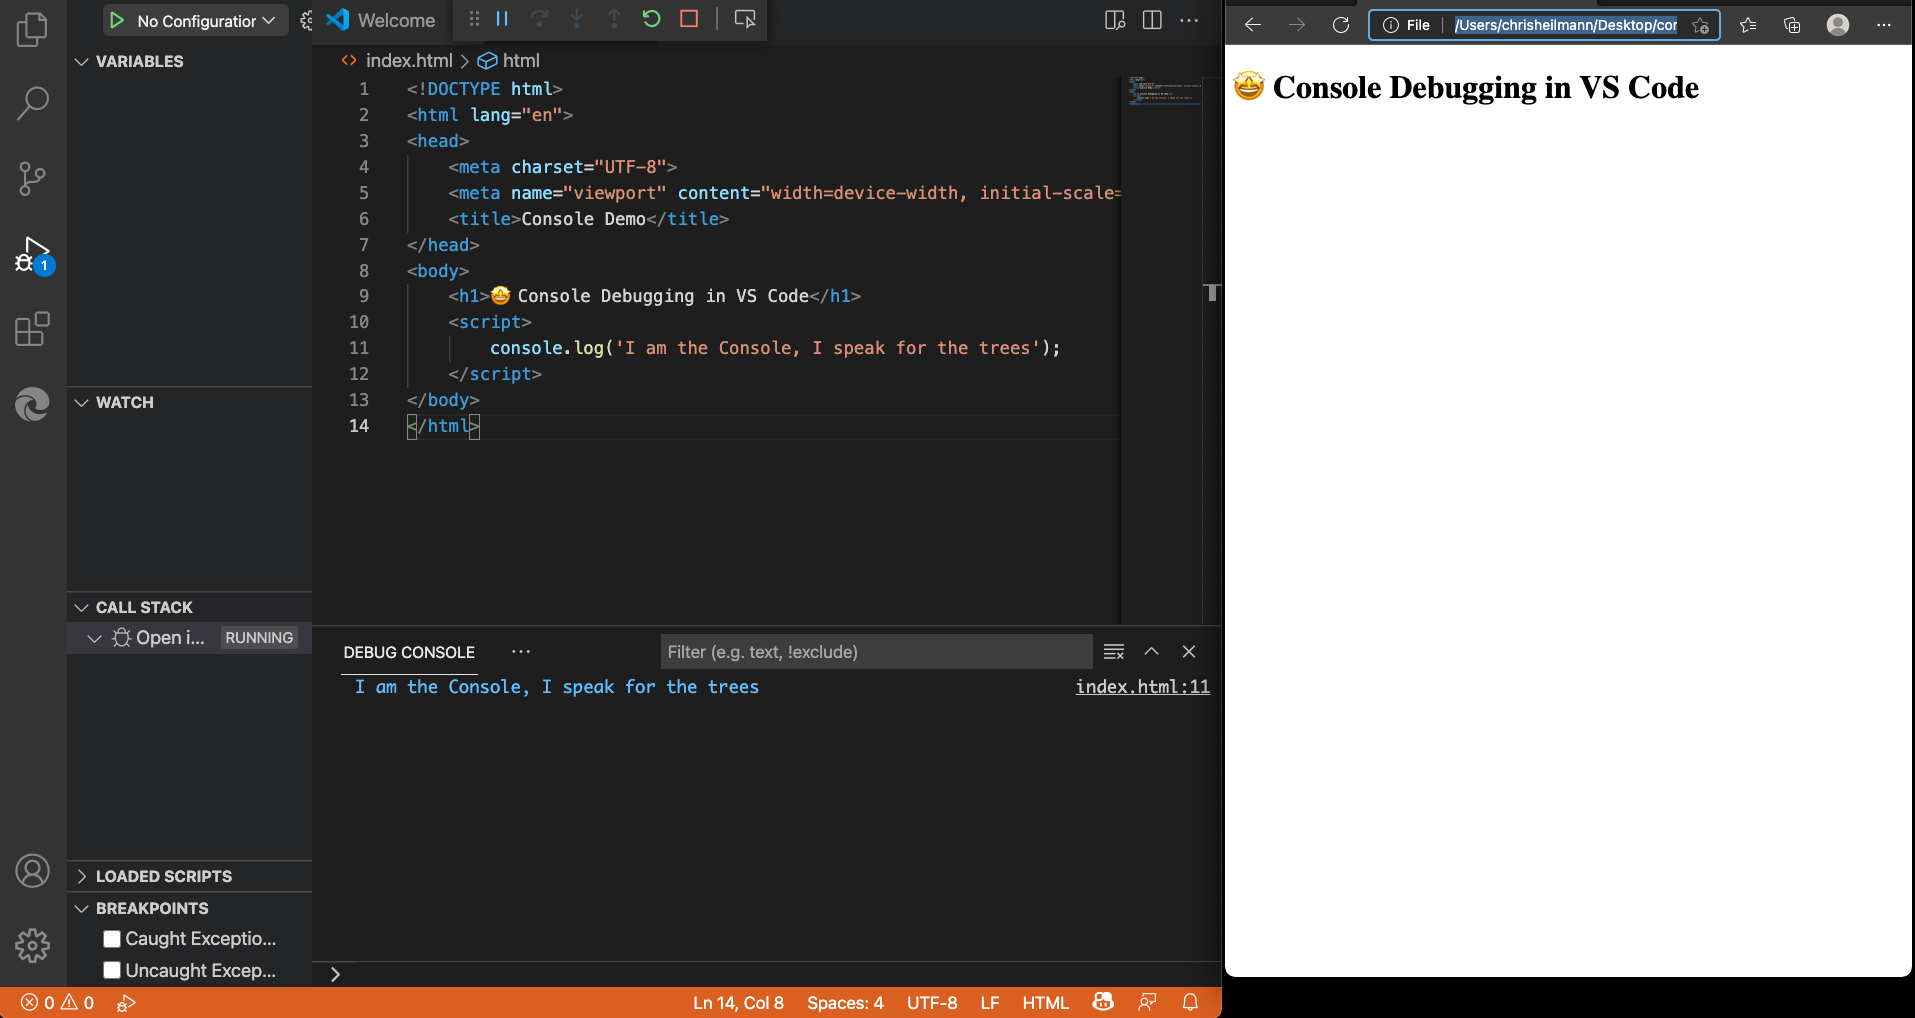
Visual Studio Code now opens a browser window for you and you can see the console.log message from the demo code in the Debug Console.
You can use the Debug Console to do anything you normally do in the Console of the browser tools. You also have access to all the convenience methods, like $ for document.querySelector. Try it out by using $(‘body’) in the Debug Console. You get all the information about the body element of the current document.
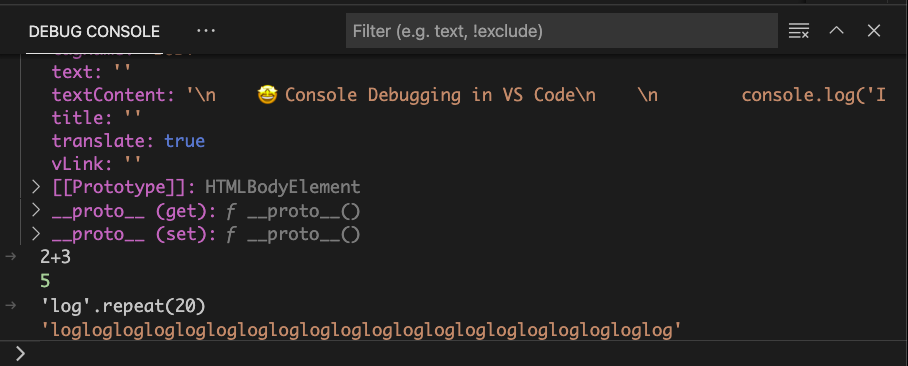
This is a full REPL console, and you can just type in any JavaScript to try out, for example 2+3 or ‘log’.repeat(20)
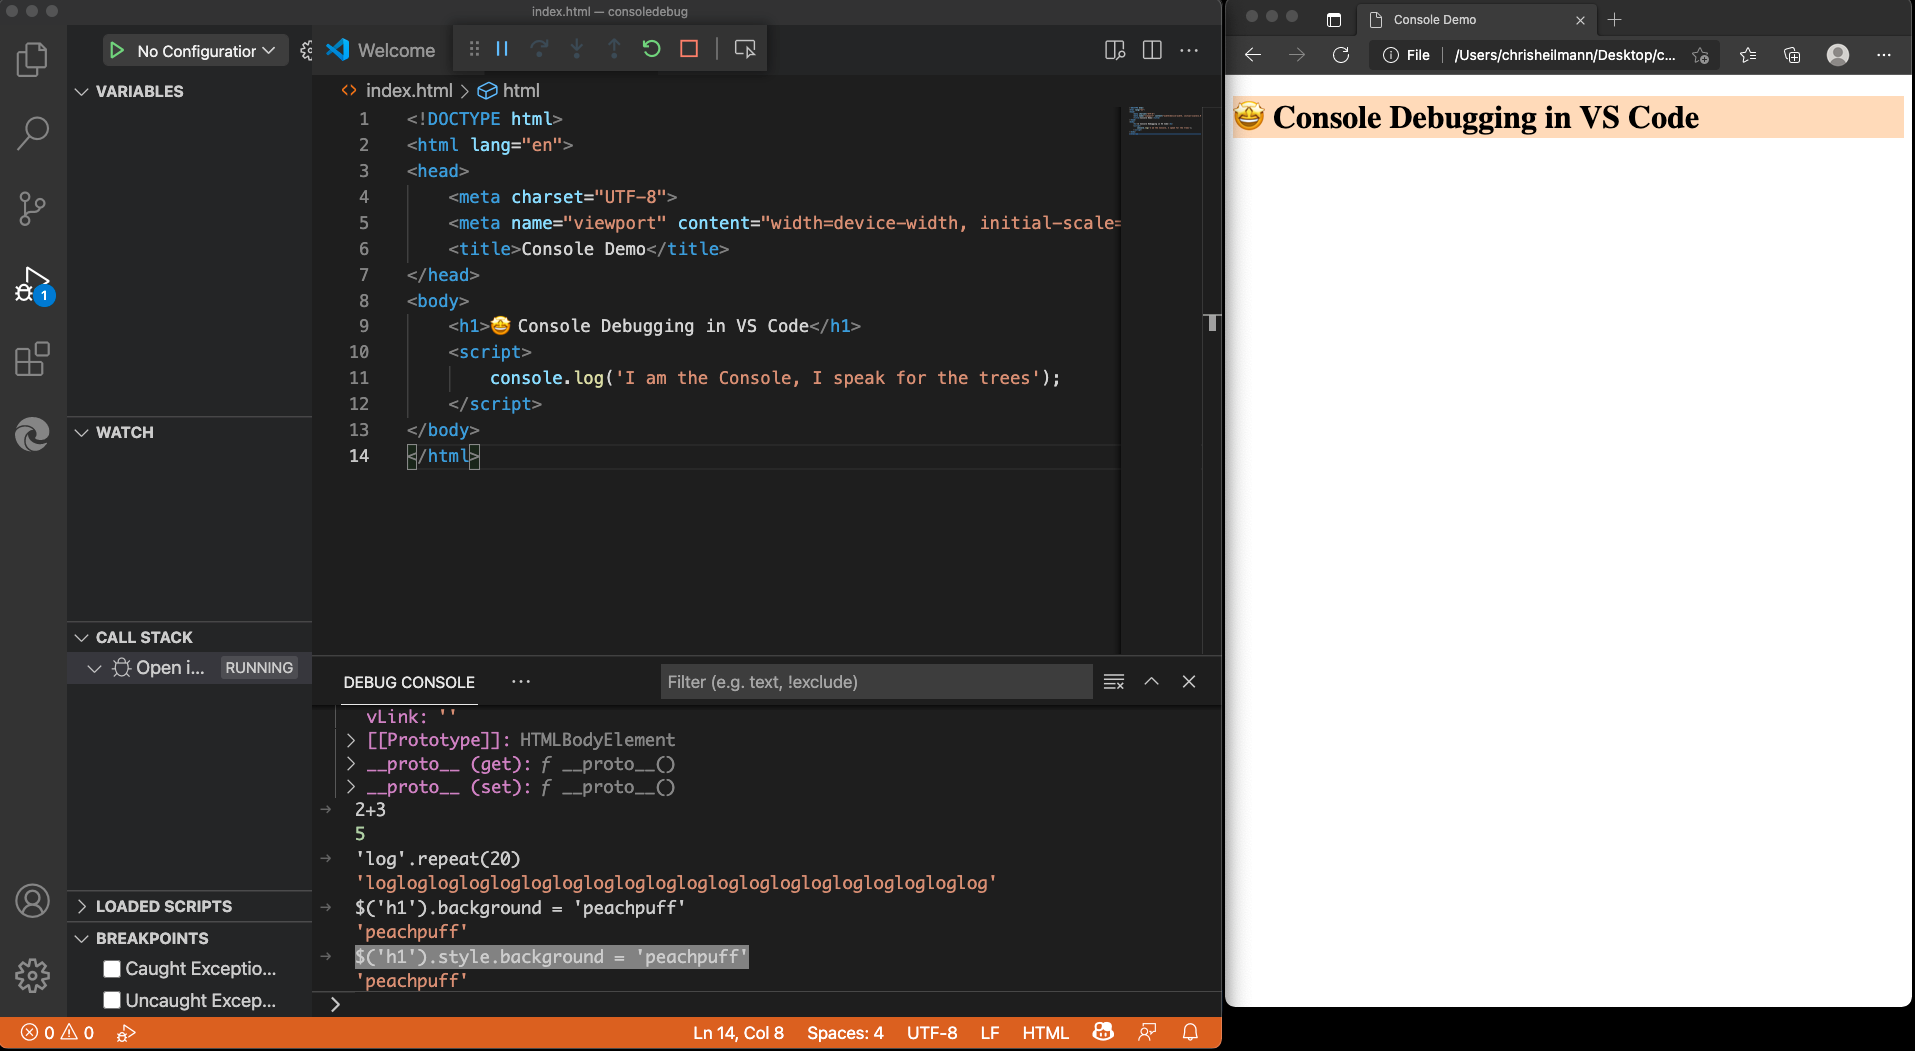
You also have full access to the Window object and the DOM of the current page, for example, to change the background colour of the document, you can use $(‘h1’).style.background = ‘peachpuff’ (and not what I did first in the screenshot).
For all the features of Console, check the documentation.
If you use Edge as your debugging browser, you also get something extra. Hitting the Inspect button on the debug bar will open the Developer Tools Elements and Network right inside your editor.
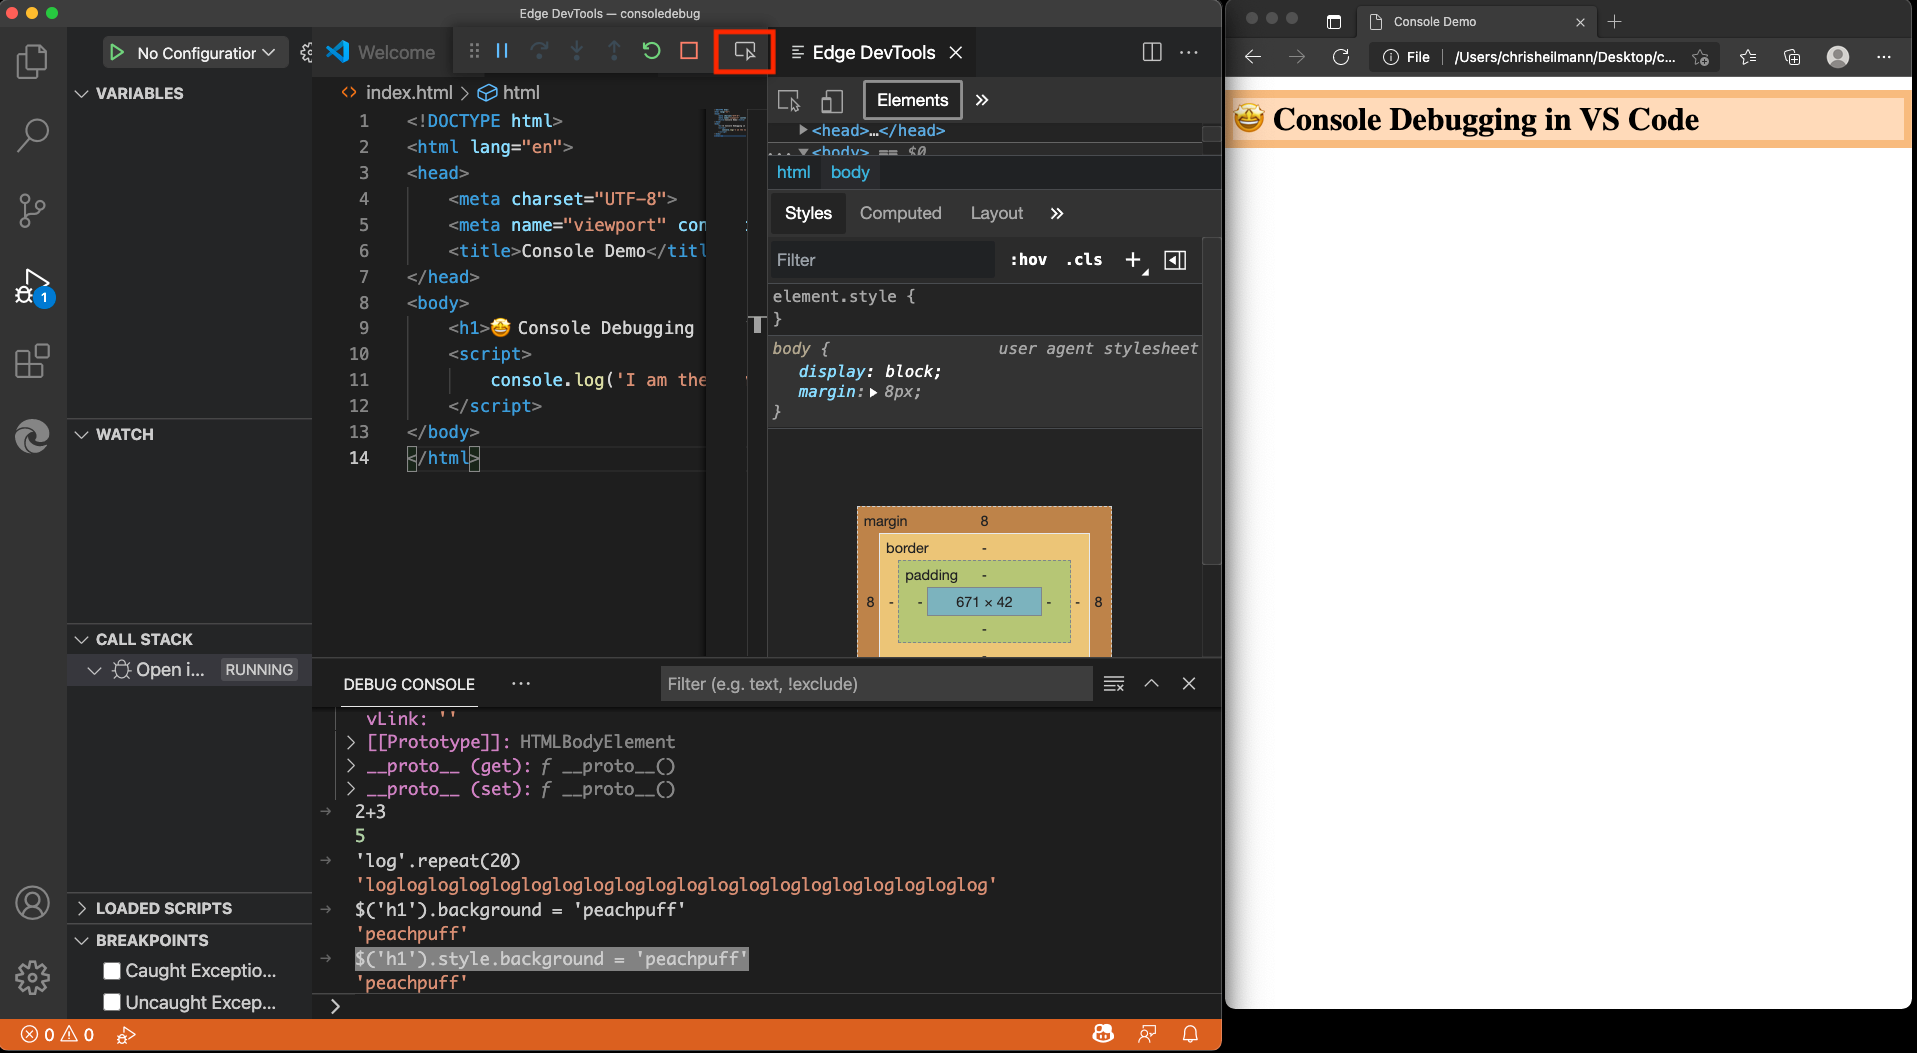
But more on that later.