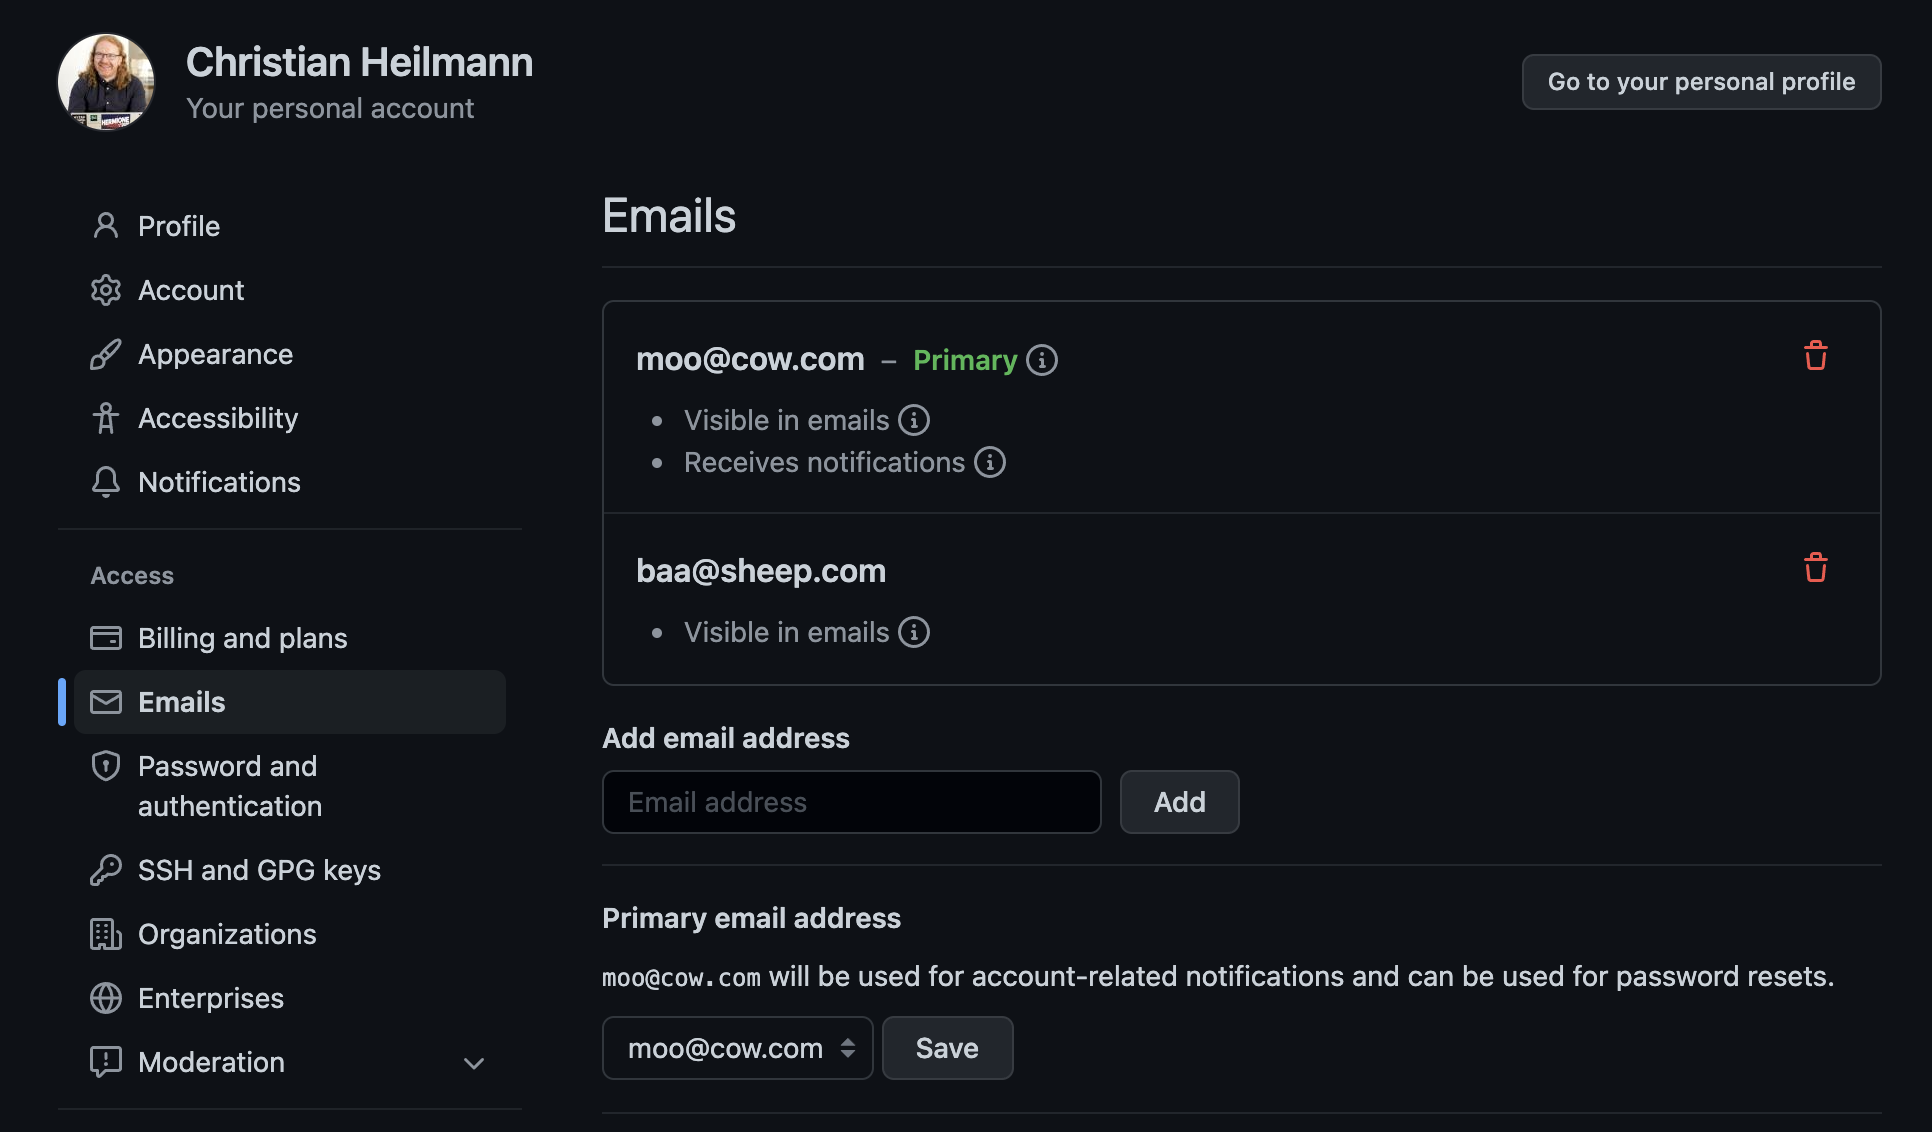
I’m part of a few organisations on GitHub and had one email address for notifications. This annoyed me as I didn’t want company notifications to my personal account as I couldn’t answer these. As it turns out, you can set up several email addresses in your GitHub account. In settings, go to Access > Emails and you can add more than one address.
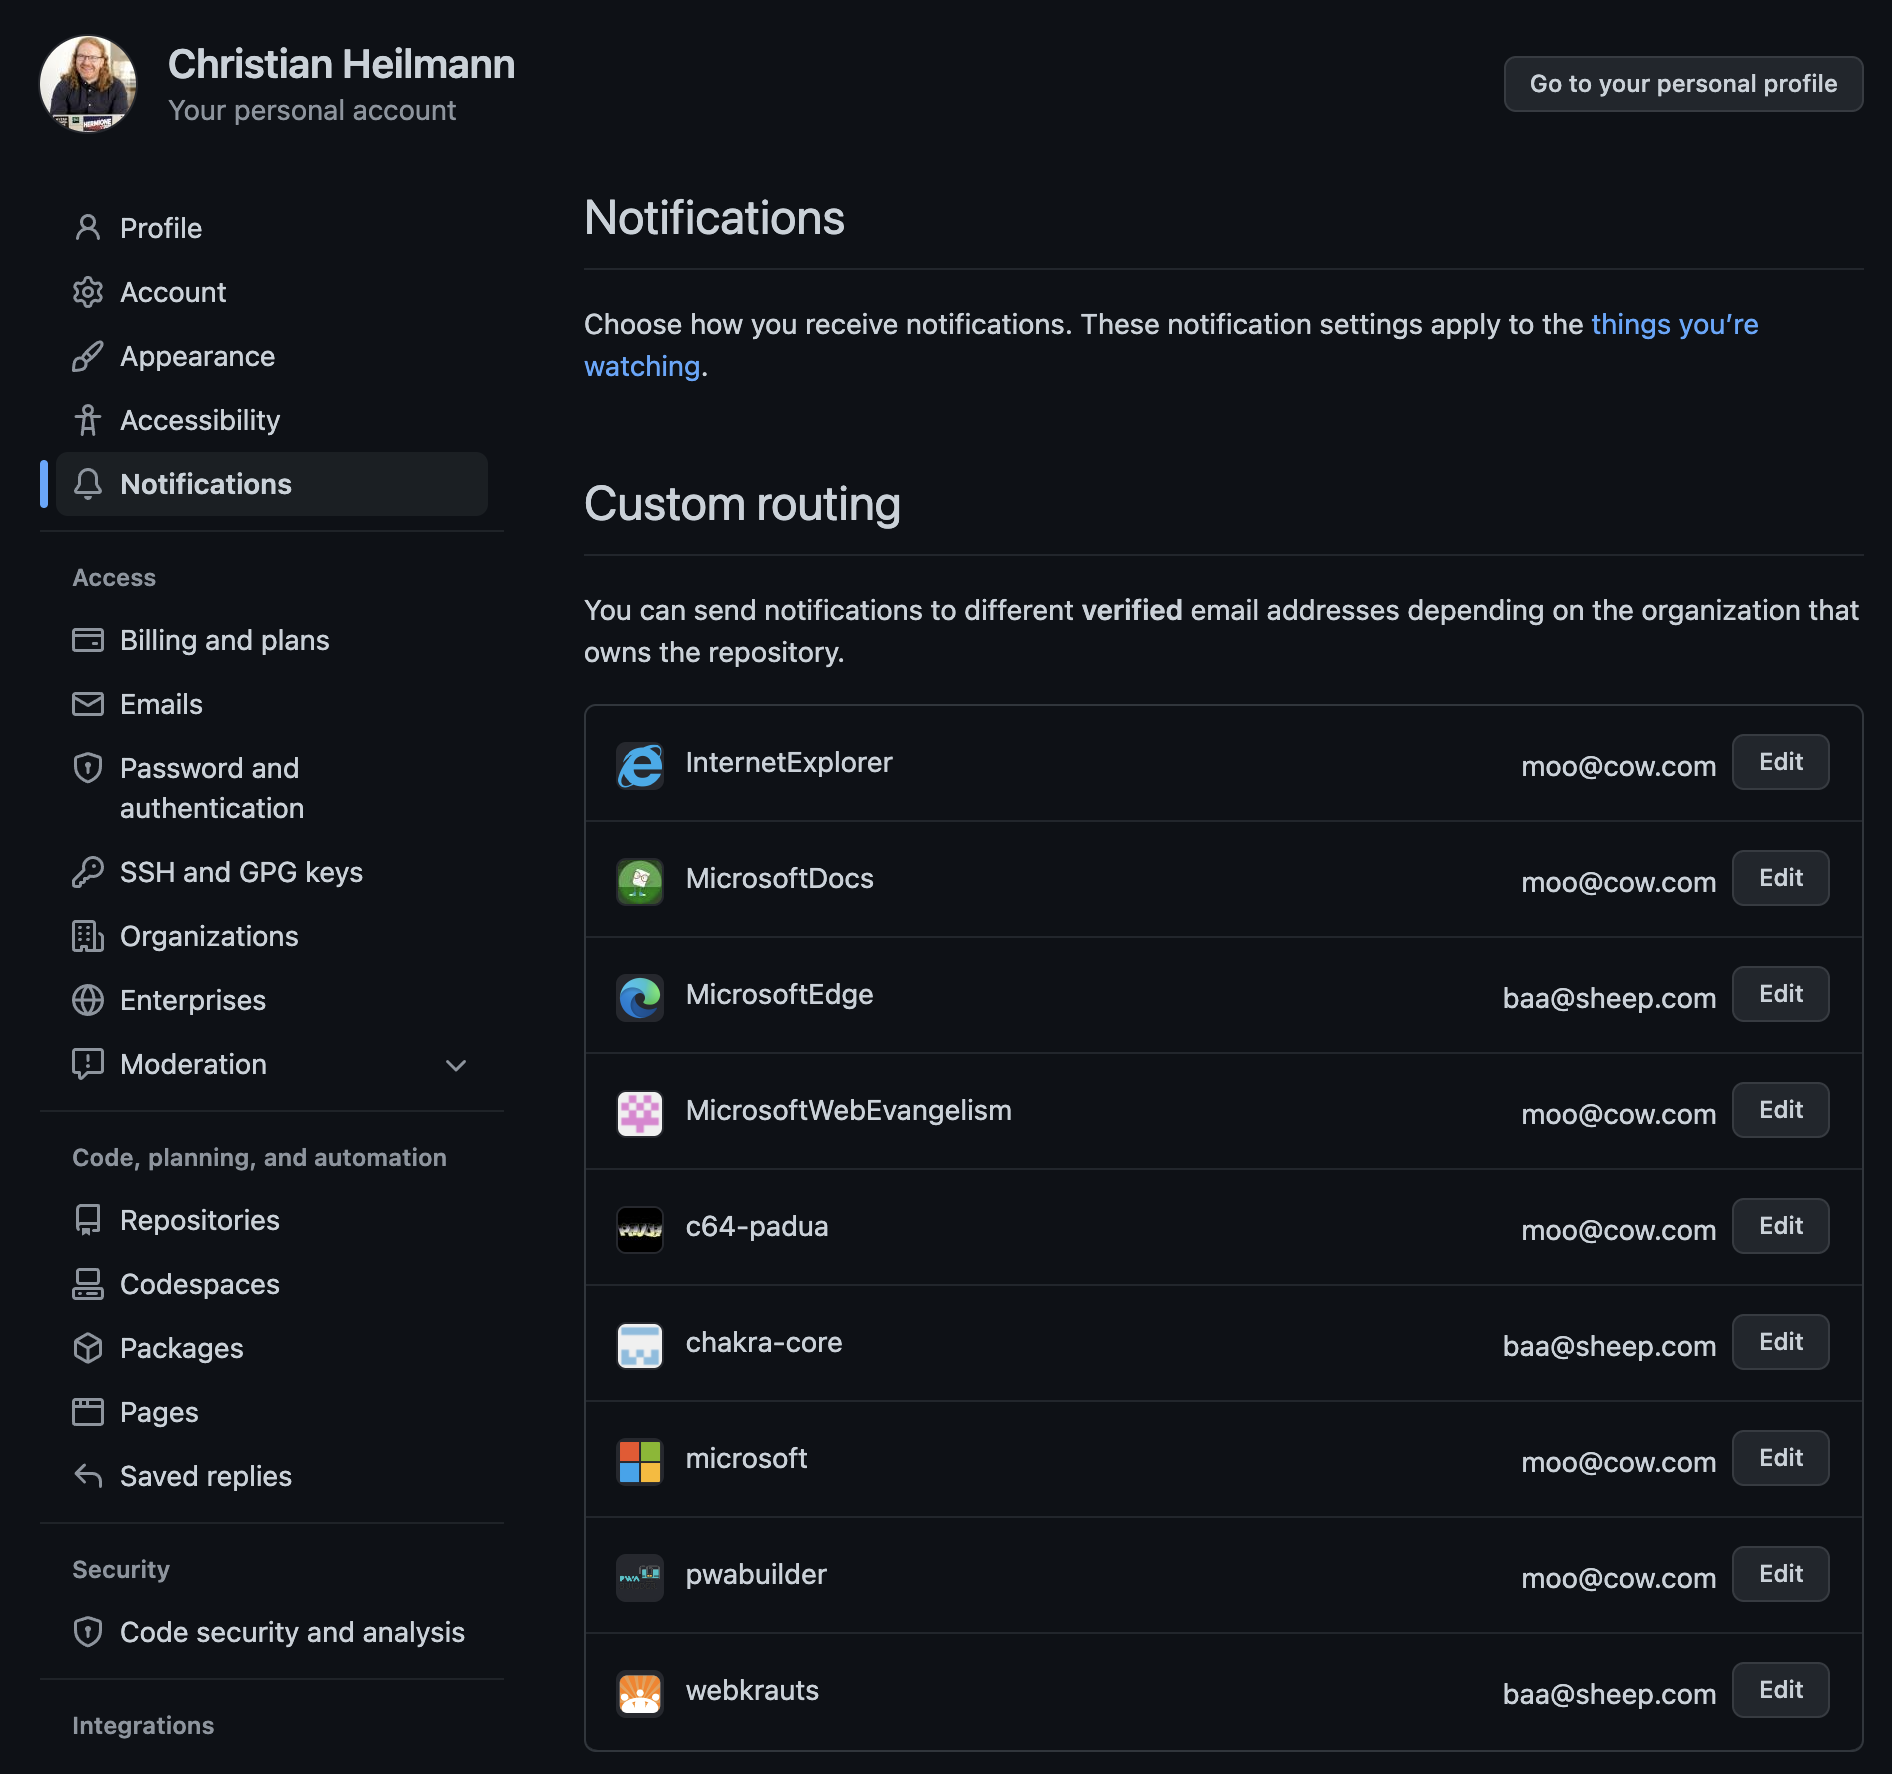
If you then go to the `Notifications` settings of GitHub and scroll all the way down to `Custom Routing`, you can define which organisation should send notifications to which email account.
Thanks to my colleague Anton Ross for showing me this!
Posted in General | Comments Off on Sending email notifications from GitHub organisations to different emails
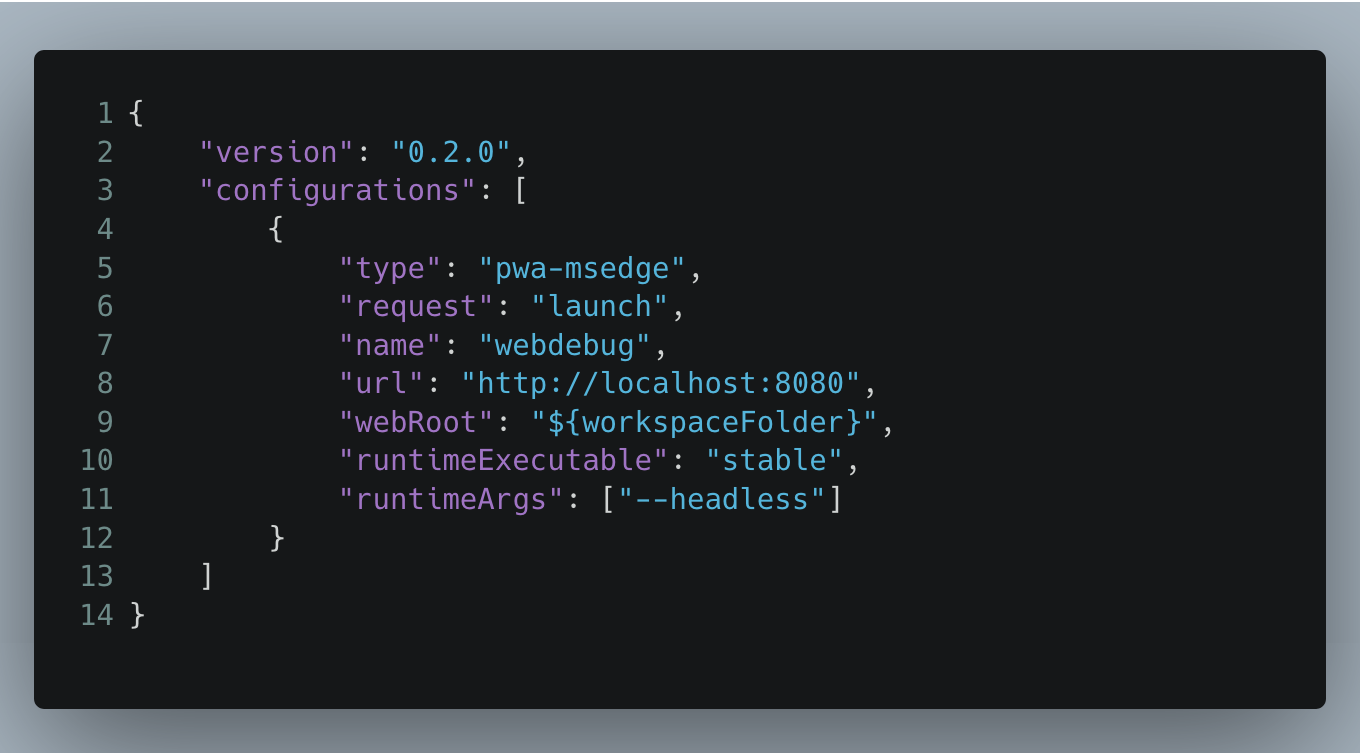
When I start a new project these days I create the following launch.json file and put in in a .vscode folder on the the root of my project.
This turns Visual Studio Code into an environment that gives me everything I need to build a web product without ever leaving it. If you want to try it out, you can use my bare bones vanilla JS ToDo app as an example, which already has the correct launch.json.
Step 1: Using the built-in Terminal
Visual Studio Code has a built-in Terminal that allows you to start a server. You can also run build scripts or do version control here. Although the in-built version control is probably more convenient.
Step 2: Starting a browser debug session
Activating Run and Debug and starting the debugging session opens a dedicated browser instance for this project. This means you get a pristine, clean browser every time. You can of course also go to localhost:8080 in any other browser if you need to rely on extensions or login data. You can see that the debug session is running as the debug toolbar appears and the lower border of the editor changes colour. In my case, from blue to orange.
Step 3: Opening the developer tools
Activating the Developer Tools icon opens the browser developer tools inside Visual Studio Code.
You can now do everything you can do in the browser, but without leaving the context of the editor. This allows you to do the changes in your DOM and CSS using the developer tools next to the source code.
Step 4: Opening the screencast
Activating the screencast button gives you a new panel inside Visual Studio Code showing the browser rendering. This is an interactive browser window and you can move the screencast tab anywhere you like in Visual Studio Code. You can also emulate different mobile environments and the browser will set the correct User Agent and simulate touch interfaces.
Step 5: Using the features
Once this is all running, you have all the features I need to build and debug my web project. you get:
Full two-way interaction between the developer tools and the source code.
If you change the CSS of an element, VS Code will jump to the correct file in your project and replicate the changes there. It will not automatically save the file. This is to prevent automatic triggering of build scripts and you probably want to try a lot of changes before you reach your desired outcome. The changes do show up live in the screencast though.
Inline linting of your code.
If there is an issue with your code, Visual Studio code will add a squiggly underline to it. You can then roll over that code and get information why it is a problem and how to fix it. If you write code, it gets automatically checked and you get a message that something is wrong and how to fix it. You can also use the Problems panel to see all the problems in the project.
Browser Console in Visual Studio Code
The debug console in Visual Studio Code is now your browser developer tools console. You can see your console.log() messages there. You have full access to the window object and you can use the DOM convenience methods and shortcuts.
Breakpoint Debugging
As you are in a debug session you have full breakpoint debugging. You can set breakpoints, interact with the project and you can go through your script step by step. You get inline information as you step through it and the execution halts while you analyse what’s going on.
Closing the debug session closes the browser
Once you are done, you can hit the stop button in the debug bar and everything goes back to square one. No need to close browser windows or developer tools sessions.
Anything missing?
We’re working on a few more improvements for this that will go live in the next few versions. Specifically we’re working on:
Sourcemap support to debug Sass/Less files
Filtering options for issues reporting
Automated fix suggestions
Integration into Visual Studio
If you have any good ideas, feel free to reach out to me or file an issue on the official GitHub repository.
Posted in General | Comments Off on A launch.json setting for end-to-end web development
This isn’t a dig at Skoop, he was just first on my timeline with a result when I did some accessibility testing.
Screenreaders read out the squares as “black large square”, “green square” and “yellow square”. As a saving grace, they cleverly do group them, so four yellow squares are announces as such and not four times “yellow square”. I love how easy it is to share your results with the web and I am sure it is a great factor of how the app spread, but an image with an alternative text of the result would have been a more accessible option.
Yesterday I was a guest on the JavaScript Master Podcast by Dariusz Kalbarczyk and we talked a bit more than an hour about my job as a Developer Tools PM, what annoys me the most about the toolintg situation and how the community can help. You can listen to the podcast on anchor.fm or Spotify .
The questions we covered were:
Please introduce yourself and tell us what you do?
The robots are coming and we need to make a great example for them. What do you mean by this text? How can we set a good example for them?
What computer did you start programming on?
What was your first computer program, were you proud of?
What has changed since you started programming in your perception of the world of technology?
Does software rule the world?
How many books have you written? What is the most exciting and what is the most difficult about writing a new book?
You work as anPrincipal Program Manager for Browser Tools at Microsoft. What is your working day like?
Why did you choose to take on developer tools as a new experience after being in DevRel for so long? By the way, what does being a DevRel mean to you?
What are the main problems you see with Developer Tools at the moment?
What are problems you face as a Developer Tools creator?
What can the community do to help you?
What are some things you are proud of having achieved in this role and how did you do it?
How big is your team? How is it structured?
What is going on in the development stack for the web that puzzle you?
You’ve been doing JavaScript for ages. Do you see patterns that keep coming up in the JavaScript community?
What is a term that people keep using that annoys you when it comes to coding and technology?
What is a finding you had in Developer Tools that might surprise people?
How do you measure the success of Developer Tools?
What is a feature you are really excited about that people should play with?
What do you think is needed to get us to become more effective as a community?
How can people learn more about what you do?
What do you think about TypeScript? Is there a chance that TS will completely replace JS in the coming years?
Do you remember the first edition of the JS Poland conference five years ago?
You will be performing at JS Poland soon, what have you prepared for the participants this time?
Non technical part:
What kind of person is Chris? How do you see yourself?
Do you have some hints for us regarding self-organization?
Do you have any favorite hobbies?
What about your work/live balance? Do you have some hints for us?
Thank you for providing a lot of valuable information during this recording. Finally, can you recommend any interesting podcast or book to our audience?
Posted in General | Comments Off on Podcast recording: Development tools in the expert’s eye with Chris Heilmann
I just released my dice simulator app and in doing so learned about a few things about turning a GitHub Page into a PWA. To make this easier for subsequent projects, I put together a bare-bones template to turn any GitHub page into a PWA. Nothing in there is sophisticated and all it does is provide installability and caching of files offline.
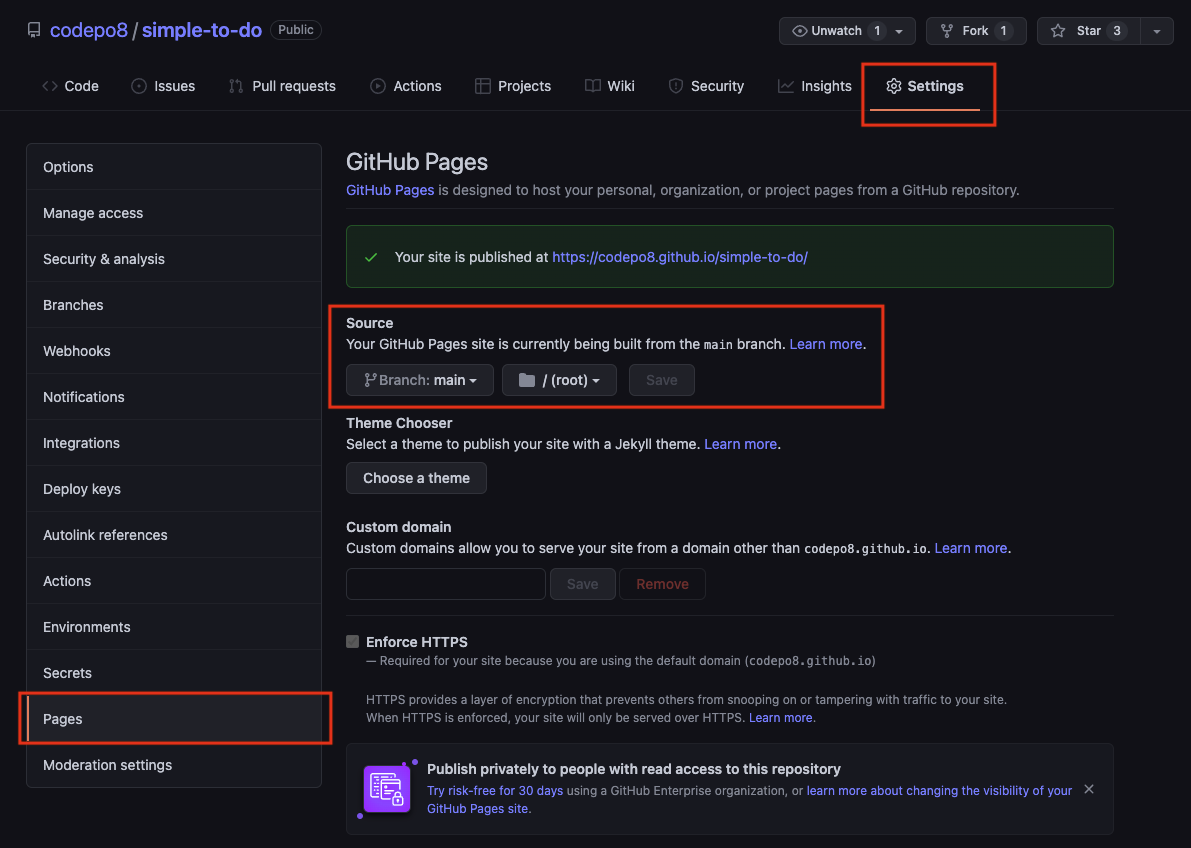
As a reminder, you can host HTML, CSS and JavaScript files on GitHub as pages. For example, I have bare bones To Do app at https://github.com/codepo8/simple-to-do with an `index.html` document.
In the settings of this repository `simple-to-do`, I chose to publish the `main` branch as a GitHub page as shown in the following screenshot.
This means that this app is now available at https://codepo8.github.io/simple-to-do/. Every time I publish to the `main` branch, it triggers an action and the page is generated.
In order to turn this into a PWA, a few things were needed.
Adding to the index.html
The first thing I needed to do change is the `index.html` document. I needed to add a link to the manifest, a canonical link and instantiate a service worker.
In the following example, each `codepo8` is my GitHub user name and `github-page-pwa` the name of the repository. The most crucial things to get right are the `/` surrounding the repo name.
<!DOCTYPE html><htmllang="en"><head><metacharset="UTF-8"><metaname="viewport"content="width=device-width, initial-scale=1.0"><title>GitHub page as PWA template</title><linkrel="canonical"href="https://codepo8.github.io/github-page-pwa/"/><linkrel="manifest"href="/github-page-pwa/manifest.webmanifest"></head><body><h1>GitHub page as PWA template</h1>
…
<script>
if (navigator.serviceWorker) {
navigator.serviceWorker.register (
'/github-page-pwa/sw.js',
{scope: '/github-page-pwa/'}
)
}
</script></body></html>
Changing the service worker to make your site available offline
The `sw.js` file is the ServiceWorker that defines which of the files in the application should become available offline.
// Change this to your repository namevar GHPATH ='/github-page-pwa';// Choose a different app prefix namevar APP_PREFIX ='gppwa_';// The version of the cache. Every time you change any of the files// you need to change this version (version_01, version_02…). // If you don't change the version, the service worker will give your// users the old files!var VERSION ='version_00';// The files to make available for offline use. make sure to add // others to this listvar URLS =[
`${GHPATH}/`,
`${GHPATH}/index.html`,
`${GHPATH}/css/styles.css`,
`${GHPATH}/js/app.js`
]
// Change this to your repository name
var GHPATH = '/github-page-pwa';

// Choose a different app prefix name
var APP_PREFIX = 'gppwa_';

// The version of the cache. Every time you change any of the files
// you need to change this version (version_01, version_02…).
// If you don't change the version, the service worker will give your
// users the old files!
var VERSION = 'version_00';

// The files to make available for offline use. make sure to add
// others to this list
var URLS = [
  `${GHPATH}/`,
  `${GHPATH}/index.html`,
  `${GHPATH}/css/styles.css`,
  `${GHPATH}/js/app.js`
]
To make this page installable as an app I needed to define the manifest.
Changing the manifest to make the app installable
The `manifest.webmanifest` file defines the name and look of the GitHub Page as an installable application. You can change the names, description, URLs and link to the icon of the application to your needs. I added comments here as to what is what.
{// Name of the app and short name in case there isn't enough space"name":"Github Page PWA","short_name":"GPPWA",// Description what your app is"description":"Github Page as a Progressive Web App",// Scope and start URL - these need to change to yours"scope":"/github-page-pwa/","start_url":"/github-page-pwa/",// colours of the app as displayed in the installer"background_color":"#ffffff","theme_color":"#ffffff",// Display of the app. //This could be "standalone", "fullscreen", "minimal-ui" or "browser""display":"standalone",// The possible icons to display. Make sure to change the src URL,// the type and the size to your needs. If the size isn't correct, // you may not be able to install the app. "icons":[{"src":"/github-page-pwa/img/icon.png","type":"image/png","sizes":"700x700"}]}
{
  // Name of the app and short name in case there isn't enough space
  "name": "Github Page PWA",
  "short_name": "GPPWA",
  // Description what your app is
  "description": "Github Page as a Progressive Web App",

  // Scope and start URL - these need to change to yours
  "scope": "/github-page-pwa/",
  "start_url": "/github-page-pwa/",

  // colours of the app as displayed in the installer
  "background_color": "#ffffff",
  "theme_color": "#ffffff",

  // Display of the app.
  //This could be "standalone", "fullscreen", "minimal-ui" or "browser"
  "display": "standalone",

  // The possible icons to display. Make sure to change the src URL,
  // the type and the size to your needs. If the size isn't correct,
  // you may not be able to install the app.
  "icons": [
      {
        "src": "/github-page-pwa/img/icon.png",
        "type": "image/png",
        "sizes": "700x700"
      }
  ]
}
And that’s it. You can start by forking the repository and changing it to your needs. It comes with an extensive README.
Posted in General | Comments Off on Turning a GitHub page into a Progressive Web App