One million broken web sites – and a way to prevent that
Tuesday, April 12th, 2022Webaim.org releases an annual report called the WebAIM Million. This is a deep analysis of the one million most visited web sites how accessible they are. And every year the result is pretty grim.
Across the one million home pages, 50,829,406 distinct accessibility errors were detected—an average of 50.8 errors per page.
This is 1.1% fewer errors than last year, but at the same time home pages of sites have become more complex. On average, home pages have 955 elements and 5.3% of those have accessibility errors. This means that users with disabilities would expect to encounter errors on 1 in every 19 home page elements with which they engage.
The most disappointing part about this state of affairs is the type of problems.
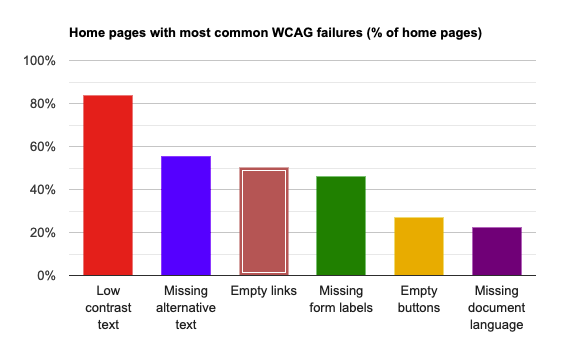
As explained in detail in the report, the biggest issues are ones that seem to be easy to avoid. Lack of contrast in text, missing alternative text for images, empty links and buttons, missing labels and no defined document language. None of these are hard to avoid or test against, and yet they went into live products.
How to test for these issues in your browser
I have a full course on Skillshare on the matter and wrote in detail how to test for these issues in the Edge Developer Tools documentation. There’s also a handy reference on which tool to use to test for each problem and even if you use other browsers, there is a lot available in those.
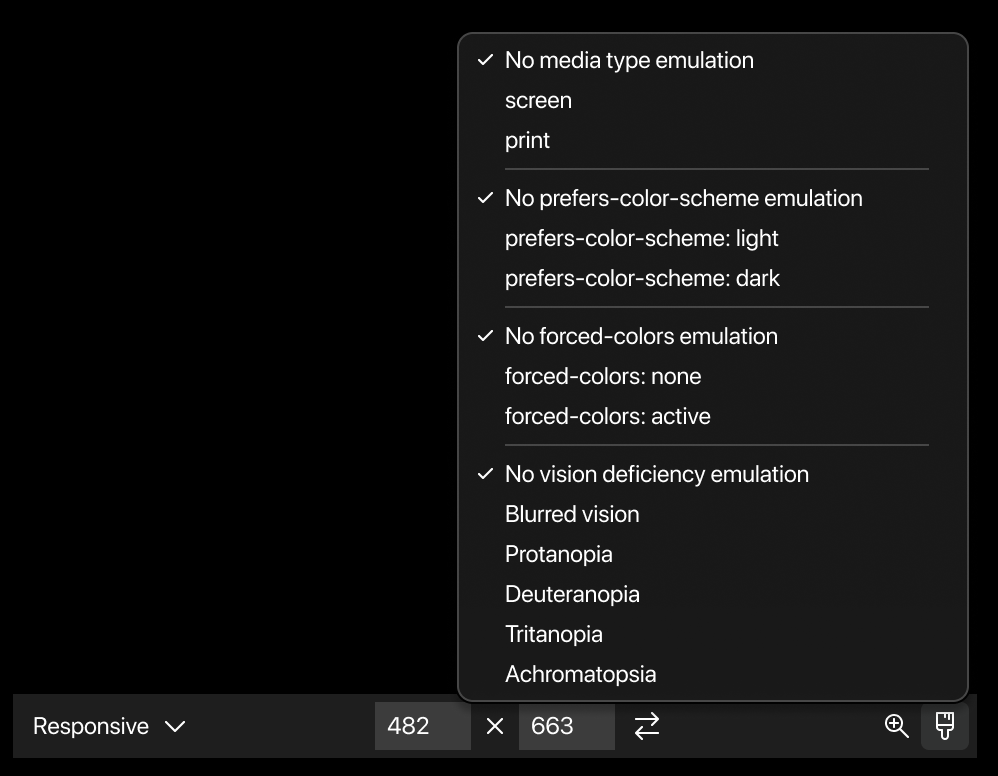
The biggest helper though are the Inspector tool and the Issues panel. The Inspector overlay flags up elements with a lack of contrast.
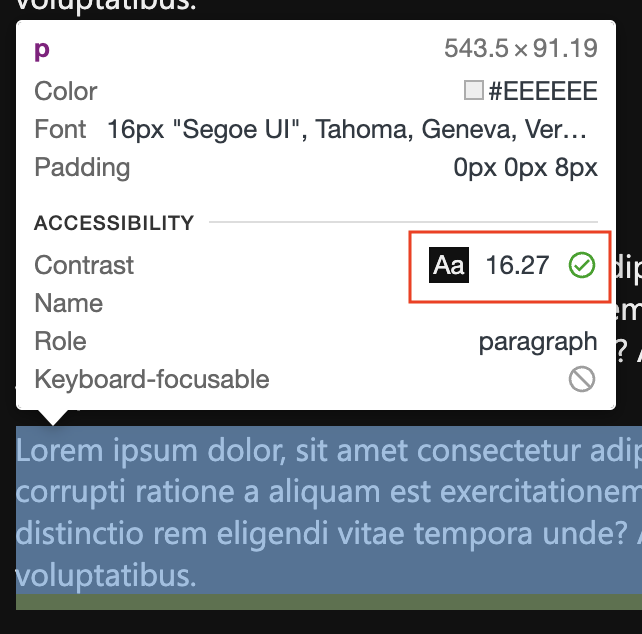
Elements with enough contrast show a check mark:
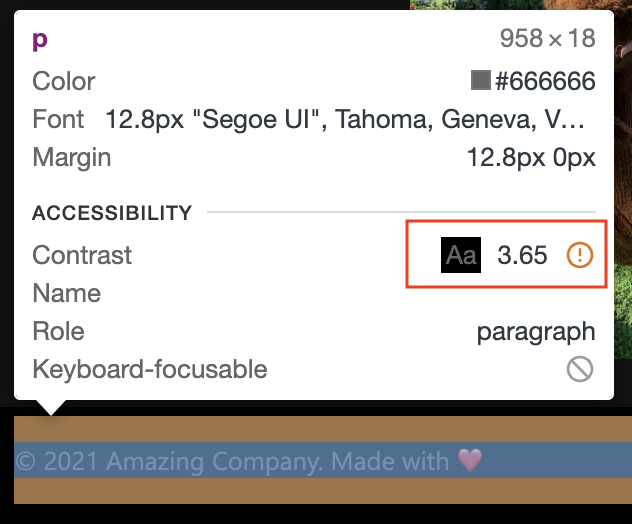
Problematic elements an exclamation mark:
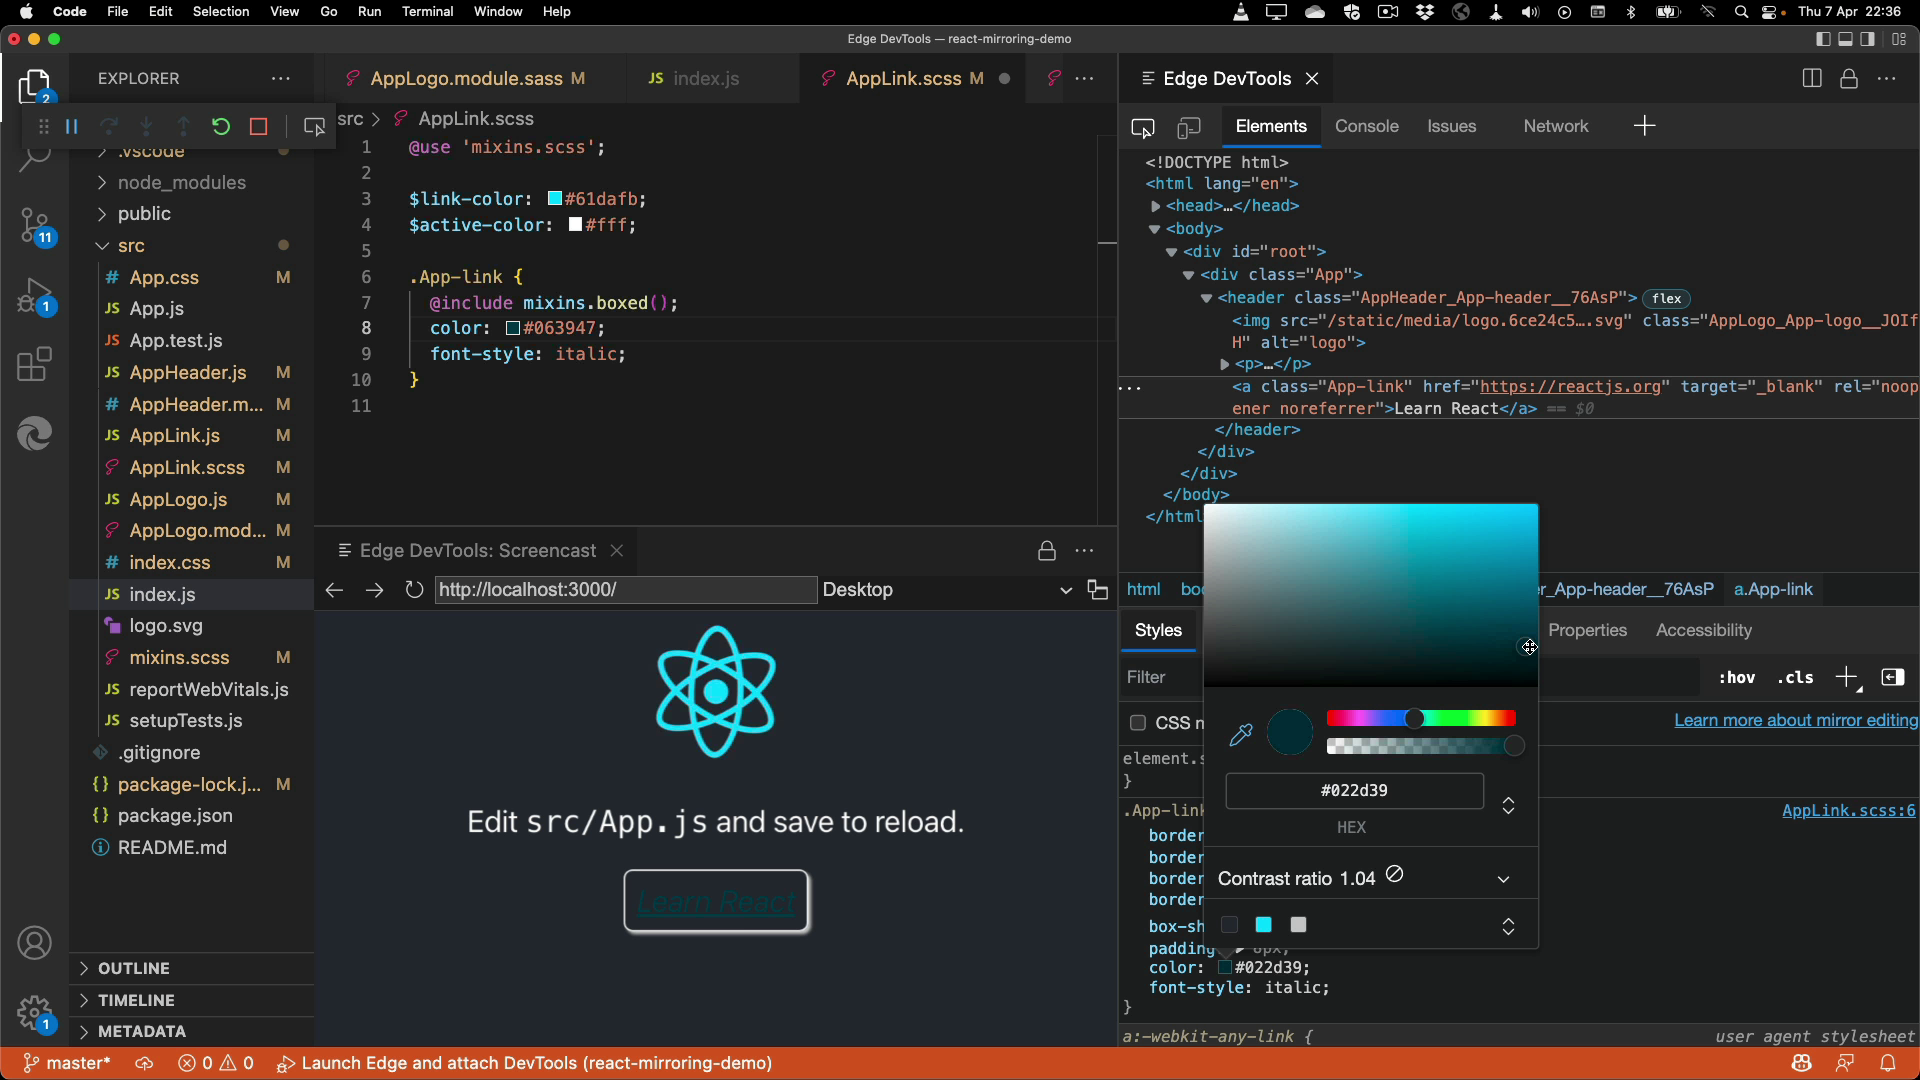
When you select the element, you can use the colour picker to define a colour with enough contrast to the background. Select the colour of the element that is problematic in the Styles editor:
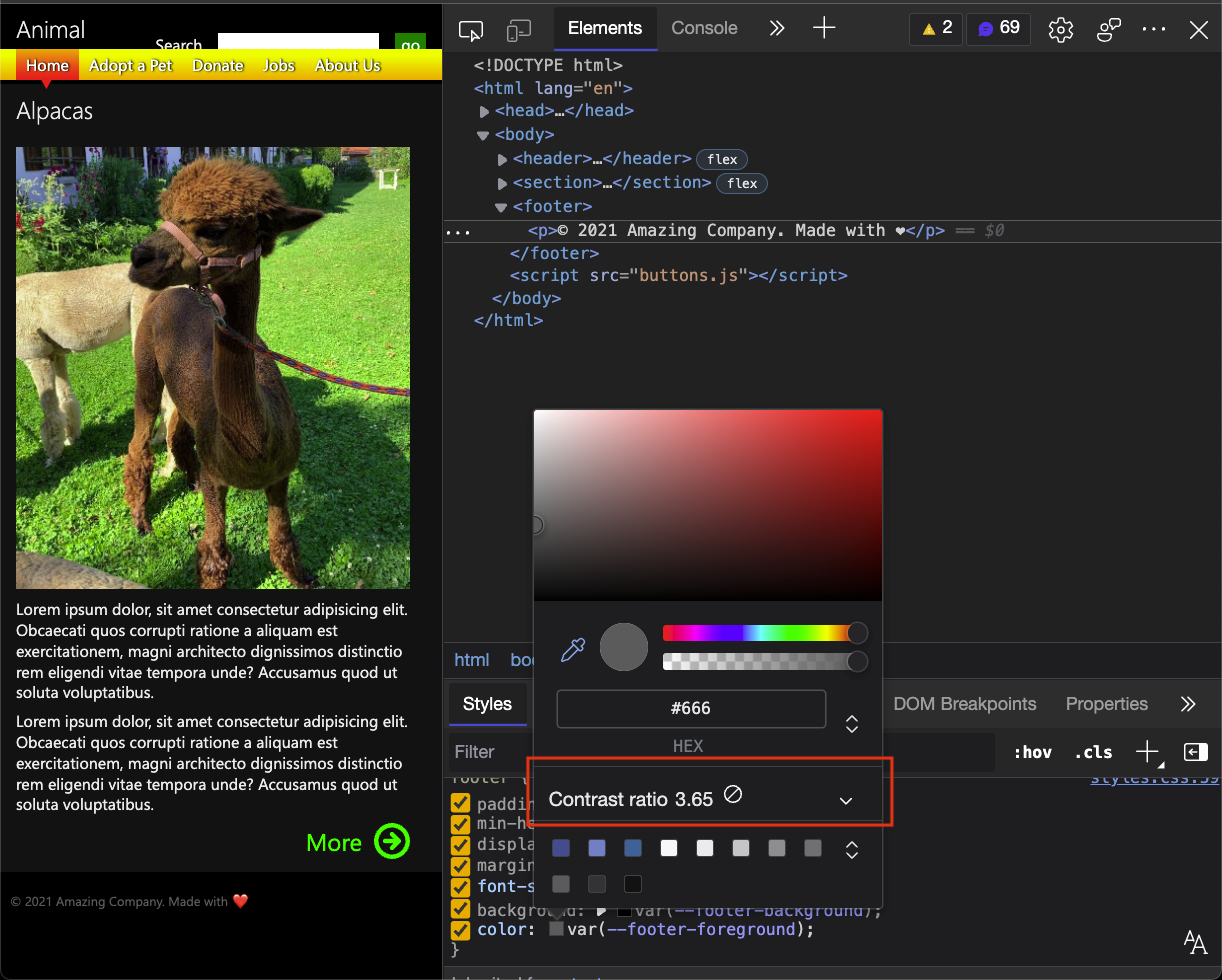
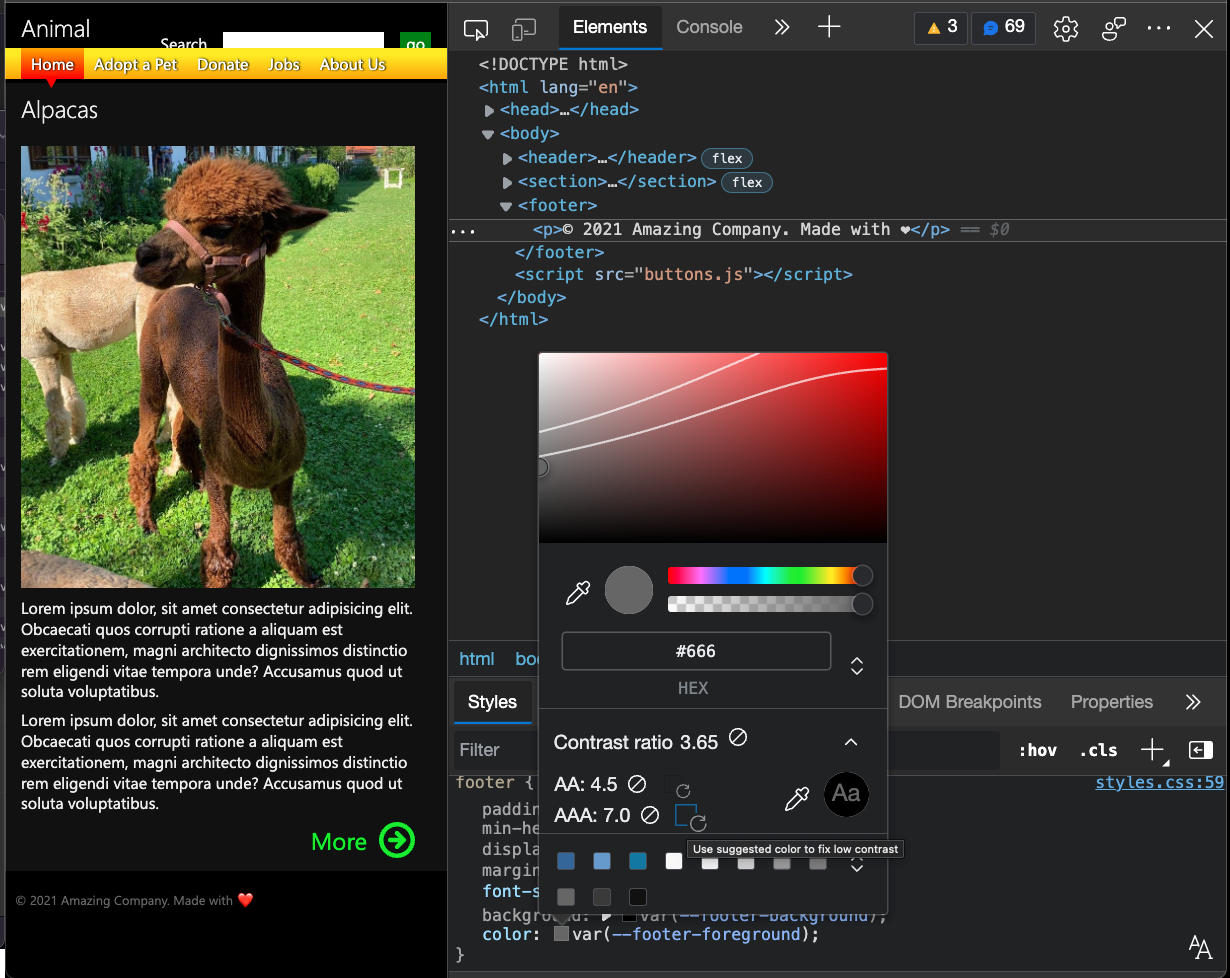
Then expand the Contrast section. It shows you the current colour, offers two colours to choose from to achieve AA and AAA compliance and you can see two lines in the colour swatch. Colours with enough contrast are indicated by the two white lines as boundaries. When you move the cursor around the colour swatch you can see the contrast of the colour and if it is enough or not.
There are also features in the browser tools to test for test for the other issues of the report as you can look up in the reference. But how about we go one level higher up the chain and prevent you from making accessibility mistakes in the first place?
Learning about accessibility issues while you develop
If you are a user of Visual Studio Code, you can get the Edge DevTools for VS Code extension, which analyses the code in your Workspace and flags up all the accessibility issues that need fixing.
Any problematic element gets a wavy underline – much like any typo does in most text editors. You can then hover over the element and get information what the problem is and how to fix it.
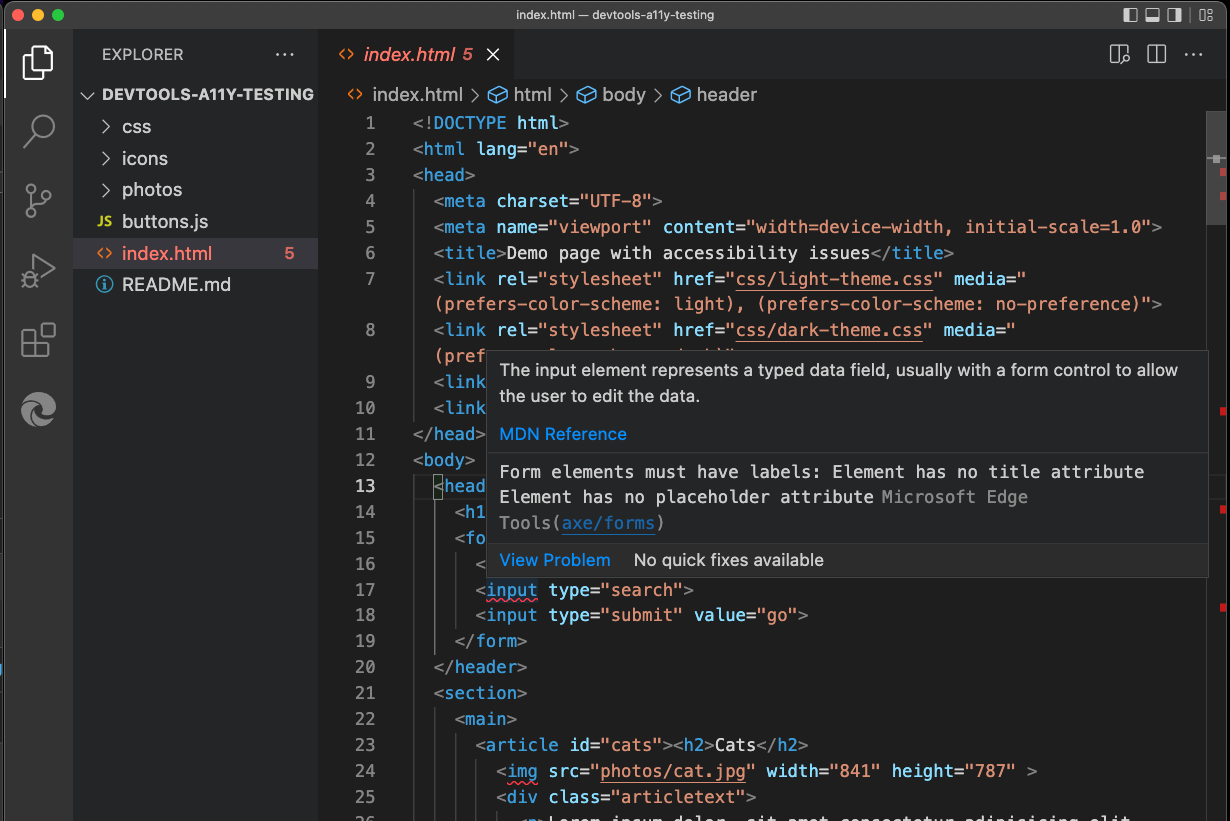
You can also see all the issues in the document in the mini map and if you open the problems panel you can see all the problems in your workspace.

These are all live, so if you edit your document and fix issues, the underlines go away and the issue is removed from the problems pane.
It’s a start…
Using these features will not prevent all accessibility mistakes. There is also the fact that many of these problems aren’t caused by developers and designers at all but by content management problems or even themes not in your control. But these things can help avoid the most obvious problems, and any accessibility barrier that doesn’t show up in a live product is already a win.