This isn’t a dig at Skoop, he was just first on my timeline with a result when I did some accessibility testing.
Screenreaders read out the squares as “black large square”, “green square” and “yellow square”. As a saving grace, they cleverly do group them, so four yellow squares are announces as such and not four times “yellow square”. I love how easy it is to share your results with the web and I am sure it is a great factor of how the app spread, but an image with an alternative text of the result would have been a more accessible option.
Yesterday I was a guest on the JavaScript Master Podcast by Dariusz Kalbarczyk and we talked a bit more than an hour about my job as a Developer Tools PM, what annoys me the most about the toolintg situation and how the community can help. You can listen to the podcast on anchor.fm or Spotify .
The questions we covered were:
Please introduce yourself and tell us what you do?
The robots are coming and we need to make a great example for them. What do you mean by this text? How can we set a good example for them?
What computer did you start programming on?
What was your first computer program, were you proud of?
What has changed since you started programming in your perception of the world of technology?
Does software rule the world?
How many books have you written? What is the most exciting and what is the most difficult about writing a new book?
You work as anPrincipal Program Manager for Browser Tools at Microsoft. What is your working day like?
Why did you choose to take on developer tools as a new experience after being in DevRel for so long? By the way, what does being a DevRel mean to you?
What are the main problems you see with Developer Tools at the moment?
What are problems you face as a Developer Tools creator?
What can the community do to help you?
What are some things you are proud of having achieved in this role and how did you do it?
How big is your team? How is it structured?
What is going on in the development stack for the web that puzzle you?
You’ve been doing JavaScript for ages. Do you see patterns that keep coming up in the JavaScript community?
What is a term that people keep using that annoys you when it comes to coding and technology?
What is a finding you had in Developer Tools that might surprise people?
How do you measure the success of Developer Tools?
What is a feature you are really excited about that people should play with?
What do you think is needed to get us to become more effective as a community?
How can people learn more about what you do?
What do you think about TypeScript? Is there a chance that TS will completely replace JS in the coming years?
Do you remember the first edition of the JS Poland conference five years ago?
You will be performing at JS Poland soon, what have you prepared for the participants this time?
Non technical part:
What kind of person is Chris? How do you see yourself?
Do you have some hints for us regarding self-organization?
Do you have any favorite hobbies?
What about your work/live balance? Do you have some hints for us?
Thank you for providing a lot of valuable information during this recording. Finally, can you recommend any interesting podcast or book to our audience?
Posted in General | Comments Off on Podcast recording: Development tools in the expert’s eye with Chris Heilmann
I just released my dice simulator app and in doing so learned about a few things about turning a GitHub Page into a PWA. To make this easier for subsequent projects, I put together a bare-bones template to turn any GitHub page into a PWA. Nothing in there is sophisticated and all it does is provide installability and caching of files offline.
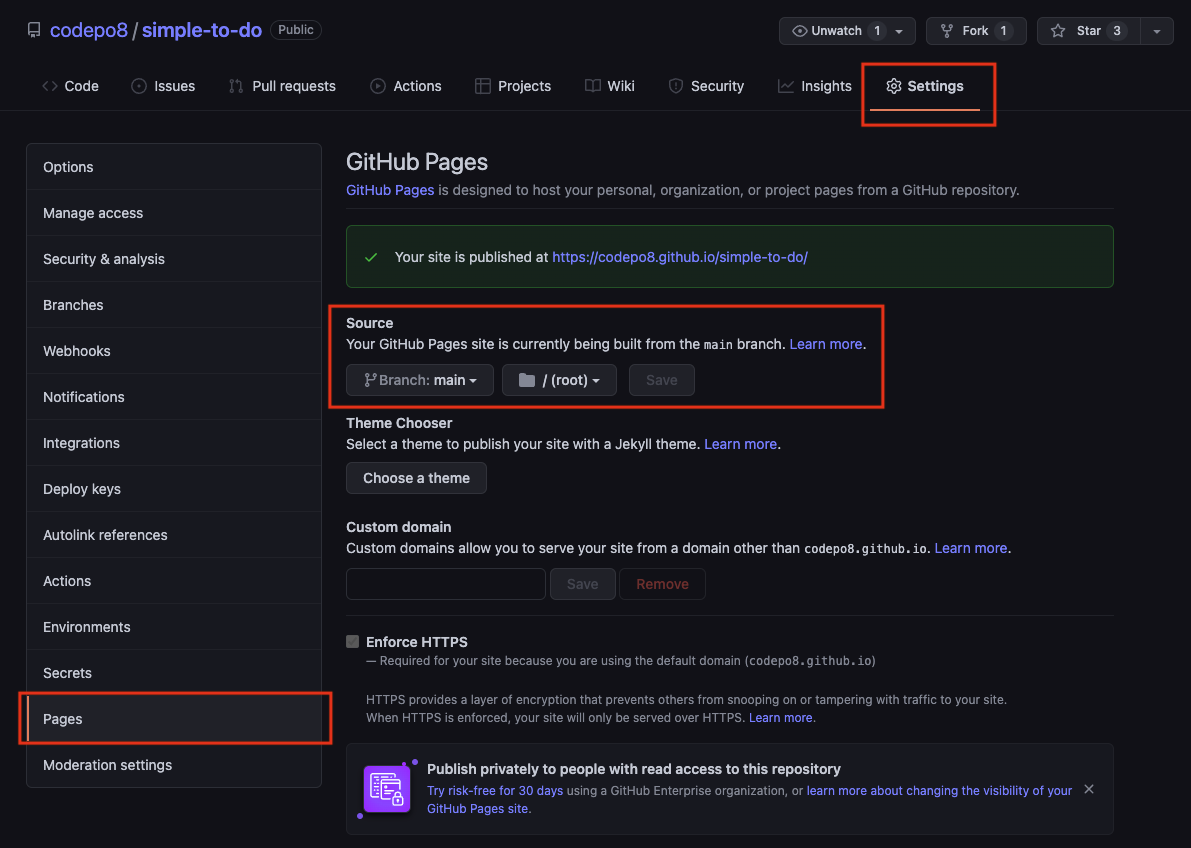
As a reminder, you can host HTML, CSS and JavaScript files on GitHub as pages. For example, I have bare bones To Do app at https://github.com/codepo8/simple-to-do with an `index.html` document.
In the settings of this repository `simple-to-do`, I chose to publish the `main` branch as a GitHub page as shown in the following screenshot.
This means that this app is now available at https://codepo8.github.io/simple-to-do/. Every time I publish to the `main` branch, it triggers an action and the page is generated.
In order to turn this into a PWA, a few things were needed.
Adding to the index.html
The first thing I needed to do change is the `index.html` document. I needed to add a link to the manifest, a canonical link and instantiate a service worker.
In the following example, each `codepo8` is my GitHub user name and `github-page-pwa` the name of the repository. The most crucial things to get right are the `/` surrounding the repo name.
<!DOCTYPE html><htmllang="en"><head><metacharset="UTF-8"><metaname="viewport"content="width=device-width, initial-scale=1.0"><title>GitHub page as PWA template</title><linkrel="canonical"href="https://codepo8.github.io/github-page-pwa/"/><linkrel="manifest"href="/github-page-pwa/manifest.webmanifest"></head><body><h1>GitHub page as PWA template</h1>
…
<script>
if (navigator.serviceWorker) {
navigator.serviceWorker.register (
'/github-page-pwa/sw.js',
{scope: '/github-page-pwa/'}
)
}
</script></body></html>
Changing the service worker to make your site available offline
The `sw.js` file is the ServiceWorker that defines which of the files in the application should become available offline.
// Change this to your repository namevar GHPATH ='/github-page-pwa';// Choose a different app prefix namevar APP_PREFIX ='gppwa_';// The version of the cache. Every time you change any of the files// you need to change this version (version_01, version_02…). // If you don't change the version, the service worker will give your// users the old files!var VERSION ='version_00';// The files to make available for offline use. make sure to add // others to this listvar URLS =[
`${GHPATH}/`,
`${GHPATH}/index.html`,
`${GHPATH}/css/styles.css`,
`${GHPATH}/js/app.js`
]
// Change this to your repository name
var GHPATH = '/github-page-pwa';

// Choose a different app prefix name
var APP_PREFIX = 'gppwa_';

// The version of the cache. Every time you change any of the files
// you need to change this version (version_01, version_02…).
// If you don't change the version, the service worker will give your
// users the old files!
var VERSION = 'version_00';

// The files to make available for offline use. make sure to add
// others to this list
var URLS = [
  `${GHPATH}/`,
  `${GHPATH}/index.html`,
  `${GHPATH}/css/styles.css`,
  `${GHPATH}/js/app.js`
]
To make this page installable as an app I needed to define the manifest.
Changing the manifest to make the app installable
The `manifest.webmanifest` file defines the name and look of the GitHub Page as an installable application. You can change the names, description, URLs and link to the icon of the application to your needs. I added comments here as to what is what.
{// Name of the app and short name in case there isn't enough space"name":"Github Page PWA","short_name":"GPPWA",// Description what your app is"description":"Github Page as a Progressive Web App",// Scope and start URL - these need to change to yours"scope":"/github-page-pwa/","start_url":"/github-page-pwa/",// colours of the app as displayed in the installer"background_color":"#ffffff","theme_color":"#ffffff",// Display of the app. //This could be "standalone", "fullscreen", "minimal-ui" or "browser""display":"standalone",// The possible icons to display. Make sure to change the src URL,// the type and the size to your needs. If the size isn't correct, // you may not be able to install the app. "icons":[{"src":"/github-page-pwa/img/icon.png","type":"image/png","sizes":"700x700"}]}
{
  // Name of the app and short name in case there isn't enough space
  "name": "Github Page PWA",
  "short_name": "GPPWA",
  // Description what your app is
  "description": "Github Page as a Progressive Web App",

  // Scope and start URL - these need to change to yours
  "scope": "/github-page-pwa/",
  "start_url": "/github-page-pwa/",

  // colours of the app as displayed in the installer
  "background_color": "#ffffff",
  "theme_color": "#ffffff",

  // Display of the app.
  //This could be "standalone", "fullscreen", "minimal-ui" or "browser"
  "display": "standalone",

  // The possible icons to display. Make sure to change the src URL,
  // the type and the size to your needs. If the size isn't correct,
  // you may not be able to install the app.
  "icons": [
      {
        "src": "/github-page-pwa/img/icon.png",
        "type": "image/png",
        "sizes": "700x700"
      }
  ]
}
And that’s it. You can start by forking the repository and changing it to your needs. It comes with an extensive README.
Posted in General | Comments Off on Turning a GitHub page into a Progressive Web App
A few days ago I was on vacation in a place that had terrible mobile connectivity and whilst it provided WiFi, nothing worked. I even brought my own cables and travel router, but to no avail. This was not only a good opportunity for some “digital detox”, but it also showed me once again that the web isn’t as resilient as we want it to be.
Here’s what happened: one evening we went to the hotel lounge to play some games. They had a library with some, but the one thing that was missing was a dice.
Not to worry, I thought, and went to look on my mobile phone to get a quick dice solution on the web. There are a lot out there, but here’s the kicker: I couldn’t find any that loaded quickly and subsequently worked offline. None. At. All. Any web search for “offline dice” resulted in tons of apps advertised to me. Other online solutions are riddled with ads and have a first load of several megabytes. Interestingly enough, searching on Desktop has better solutions – the place were you are less likely to need a simple solution that works offline. There is also a huge difference between search engines.
Even those that are excellent in their randomness like the one on random.org do a reload of the whole page on every “throw” of the dice. Others implemented the sides of the dice as images and didn’t preload them.
“Simulating a dice throw” is an example of every programming language tutorial I’ve ever seen. I remember learning BASIC and Pascal and these were parts of it. I’ve also seen this come up in job interviews back in the day. Offline functionality is also not that hard to do. A simple single-purpose web product like a dice simulator should be not hard to release. It seems the lure of selling it on an app store or making money with it by surrounding it with ads is a bigger incentive though.
The solution was to go back to the hotel room, get my laptop and write a JavaScript solution in a local file whilst my partner went out for a cigarette break. I am not proud of the code, but I also had a few drinks before – and it did the job.
It made me think though. Despite dozens of tutorials, books, presentations and videos, considering offline and bad connectivity is still not ingrained into our thinking as developers.
When HTML5 became a thing and the web went mobile first, offline availability was a main need to match native apps. Earlier approaches like AppCache had a lot of issues which is why we came up with ServiceWorker. ServiceWorker went through a lot of iterations, and as it was designed to cater to a myriad of use cases, it became complex. Many people use abstraction libraries like Workbox instead.
And, I am to blame, too. Last year I released a dice emulator for fun and the thing I didn’t do is to make it work offline. Although it was a single HTML document. Now I added that functionality. So if you go to it now, it loads quickly even on a horrible connection and will subsequently work offline. You can also install it as an app.
I will write up in detail how to do that, but the source code should give most of the clues. The biggest obstacle was to make it work with GitHub pages rather than a bespoke domain (which I may add later).
To me, this taught me to be more concerned about edge cases of our users. I want the web to be there for people when they need it. And if the functionality they need is a random number between 1 and 6 they shouldn’t have to download an app for that. So let’s embrace a flaky web in everything we do.
Posted in General | Comments Off on Offline? No dice!
After 25 years of working for, on and with the web, I am looking at the current state of it and I don’t like it. There is still a lot of beautiful, creative and amazing work out there, but on the whole, we lost an amazing opportunity. In its place we have a consumption machine that creates bubbles and assumes new users to be incapable of making own decisions.
I’ve talked about the sorry state of the internet back when it was all about replacing it with apps in my keynote of the Internet Days 2016.
And now, five years later, I’m not sure things recovered and got better. Instead I have a feeling that the basic ideas of the web became forgotten.
Hello world web
Let’s go back to when I started with the web. I’ve been on BBSes, Newsgroups, IRC, mailing lists and swapped floppy disks via mail before that. All to get information and software. Then the web came around and I got hooked immediately. For my personal use, the first things I visited were demo scene related – a remnant of the BBS days. From a professional point of view, I worked as a newscaster in a radio station. Having access to the web gave me access to the news feeds from the German Press Association at any time. Before that, we got faxes with their gist every morning to work from. As I used that wild new thing called world wide web, we had more information than other stations or newspapers. This helped my career a lot.
The link was the currency
The information flow was pretty much dependent on knowing the source. You learned about different URLs from discussion groups, forums, IRC and mailing lists. You spent a lot of time maintaining a great favourites folder or – in my case as a die-hard Netscape fan – your bookmarks.html document.
As a publisher, you submitted your sites to site directories like Yahoo Directory, or dmoz – another very early player. You also connected to other site maintainers and exchanged links or joined web rings to connect with similar sites. All for free, as your main interest was to get people to read and consume what you wrote.
I’ve blogged since 2005 and your blogroll was a sign of pride. You connected to other publishers to show your shared respect and ideas, not to get lots of links back.
And then there were search engines
In the beginning search engines were hit and miss. I remember using Altavista, Lycos, Dogpile, Hotbot and in Germany Web.de and Fireball. Fireball was the first I remember that had live search results being displayed. And as there was no filtering, you can guess what the outcome of that was.
With the rise of Yahoo to a search engine, and especially with the emergence of Google this all changed. Most of the smaller search engines got bought or died. Some specialised to certain markets and subject matters to survive.
But fact of the matter was and is that Google rules supreme and more and more a search result was much more important than maintaining good links.
Now, I don’t want to venture into Search Engine Optimisation (SEO) discussions here as I already had a shower and don’t want to scrub myself again. But, I am pretty certain that whilst having a good, solid, URL with a great structure for human readability still has merits, most success with search engines these days is ads and payments. Link farming, creating tons of fake web sites all linking to another and other dirty tricks of SEO made sure of that.
I get emails daily from people asking me to write “relevant content posts with a few links” for my blog. I specifically state in my about page and on my footer that I don’t publish third party content, but that doesn’t matter to an automation bot. It goes to show that old content that was part of dmoz and others does still count to a small part. But it also shows that there is a lot more gamification and “growth hacking” at play than publishing good content and hoping for an audience.
And this comes to me with disastrous consequences to the web I got to love over the years. Search engine results – especially on mobile – have become useless if you want to have any detailed information. If you want to get a lot of ads shown to you, you’re in luck.
Today I got some moving crates from a self storage place down the road and gave them to my partner. She texted me a few hours later that it isn’t obvious how to fold them, and I smugly went to the web to help her. I challenge you right now to find a tutorial on how to fold a Shurgard moving crate. I got lots of ideas where I can find self storage in my neighbourhood. I also know all about their services, but there is no place where it states how the hell you fold their specific moving crates.
In the web of old, there is a good chance I would have found some unknown person’s blog post or even Geocities page that proudly showed how to do that. These days, an avalanche of ads and videos that show how to do that with other crates buried that knowledge. And that’s beside it being specific enough to warrant an entry on the Shurgard web site.
Welcome to the content rat race
The main problem I see is that the early investment in the web isn’t a thing any longer. We don’t create content for the web and for longevity. We create content to show ads around it. Consumption has gone down from minutes to seconds. Addiction machines like Facebook, Instagram and TikTok are heralded as the way to go.
Where in the past the number of visitors was interesting and backlinks we all got brainwashed by apps and walled gardens that stickiness and duration of usage is the most important thing.
In my TedX talk 8 years ago I talked about that and explained how apps are a huge step back in software distribution.
I likened apps to Tamagotchi that keep pestering us to feed them but won’t even die if we don’t. Moving on to now, this is what every web site has become. Probably in a senseless attempt to beat apps and the Facebooks, Amazons and Video consumption platforms out there.
Want proof? I worked on a lot of progressive web apps functionality over the years and believe that there is a middle ground of canned application and web site. And when it comes to demands from publishers of PWAs, there is not much about access to hardware or clever new web APIs. The biggest demand was about notifications and making sure people stay in the app or keep coming back to it.
That’s what happens to any web site right now. I click an ad for a product I am actually happy to buy. I go to the web site and get asked to allow for notifcations. No, I came here for a certain reason, I don’t want to be your friend. While I am looking at the product I will get a popup to sign up for a newsletter or friends and family program. And that is how you lose me. I don’t care if I save money, I get this from somewhere else where I learn about the product, not get pestered about my future dealings with the store I went to. This is about me as the customer, not about you and your monthly active user numbers.
Even worse are image results. I love that search engines allow me to look for images and even filter by licence and many other features. I loathe that 90% of image results are pointing to walled gardens that ask me to sign up before seeing it. I really wished search engines would not show me Facebook or Pinterest results unless I am also logged in there.
I miss the web
I miss having the web as a resource. As a library of knowledge and a collection of weird and wonderful entertainment and subculture art. When the web came out it was revolutionary and challenged TV and radio. I didn’t have to wait for a certain time to learn about a new movie – I could read up on it any time I wanted. I could read from other people what they thought of it, instead of having paid influencers with pre-fed soundbites tell me why it is sooooo amazing.
The problem is that search engine results – especially on mobile – are not how you find that any longer.
Curated link collections to the rescue?
One thing that didn’t change as much over the years and has quite a renaissance right now are curated link collections. In the past these were social bookmarking sites with delicious being the big player there until Yahoo axed it because it had its own bookmarks product. These days I personally use Pinboard.in to record all the links I tweet about. I also use Feedly to read RSS feeds and most of what I post in social media came from there. Both are products that allow me to curate my findings, share it with people and follow others. Much like the web used to be in the past.