We just released version 1.4.6 of the Edge DevTools for VS Code extension and the main change is that the Console tool is now available in the extension.
There are two caveats at the moment: in order to see the Console, you need to use Edge Canary as your debugging target (version 101.0.1193.0+) and it can happen that the you need to refresh the target once to see the Console light up. This is a bug in VS Code itself and will be fixed in the upcoming version.
New automatically created `launch.json` settings
To give you the best debugging experience in VS Code, we updated the `launch.json` settings when you generate it from the extension. The new file offers you a headless debugging experience by default calling the correct version of the Edge debugger.
You can see it them in action in the following screencast:
If you want to see the Console tool right now and not until 101 is the stable version of Edge, you need to add a `”runtimeExecutable”: “canary”,` to the launch.json to target the Canary build of the browser.
We add two more lines to the existing `launch.json`, defining a task to run before debugging starts and one after it end. Let’s call them `start server` and `stop server` respectively:
Tasks are meant to run, have an end and then tell the debugger that they are ready. Normally you would, for example, use them to do some conversion or pull some information. In this case, it is a bit trickier, as we start a server and that doesn’t give us any feedback. The task never ends as the server starts and keeps running.
The `start server` task is a `shell` task, should run in the background and the command it executes is `http-server`, which is the NPM module of the same name. The presentation property is set to silent, which means that when the server starts, it doesn’t pop up the terminal in Visual Studio Code. When we use background tasks, we need to define a `problemMatcher` that tells the debug process if the task has executed successfully or if there was any issue. This can get rather complex and you need to parse the output on the Console with Regular Expressions. In this case, we keep it very open and allow anything reported on the output Console to be a success (RegEx “.”).
What this task does is open a new Terminal, enter “http-server” and hit enter for us. And once that’s done, we have a local server at our disposal, making the current Workspace folder available as `localhost:8080`, which is also what we defined in our `launch.json` as the address to navigate to.
The `stop server` task is a bit simpler. we just make it send a `terminate` command to the terminal. We then use an `inputs` directive to define the `terminal` CLI command as something that calls `workbench.action.tasks.terminate` with an argument of `terminateAll`. This closes any Terminals opened by tasks earlier.
And that’s all there is to spawn a new local server when you start debugging and close it when the debug session ends.
There is currently a bug in VS Code, that throws an error in your tasks when the `Problems` pane is not empty when the task runs. In the case of using the Edge Developer tools for VS Code extension that means any issue reported there will result in this problem. I reported this to the team and they are working on a solution.
If you want to see this in action, you can fork the simple to-do demo and run it locally. Make sure to have http-server installed via NPM.
Posted in General | Comments Off on Automatically starting a server when starting a debug session in VS Code
I like noise cancelling headphones. Using them, I can sleep better on planes and find much more detail in music I enjoy. In the office, they are a visual clue that I am currently unavailable for feedback as I want to concentrate on a task at hand.
We live in times of a constant information flow. Where in the past research was a tough task and you had to know where to look, we now need to know what not to consume. Our main jobs are filtering and discarding false information, not finding sources.
Matt Haig’s bestselling book Notes on a nervous planet is a great read on that topic. It is easy to be on edge as we have such a vast amount of information to consume and instead of reflecting on our learnings, we chase even more information. Being up-to-date is the most important thing. More important than verified information or taking the time to do anything with this information.
In the book, Haig also brings up the problem of social media presences. People show their best sides with lots of filters and little “fact embellishments”. Other people get frustrated consuming those as their lives aren’t as glamorous. Even worse, the people who posted the things that made others jealous aren’t happy either. They are getting depressed because their real lives aren’t like their online profiles. And they live with the burden of having lied to the world by feeding a fake persona instead of nurturing themselves.
The myth of the “always switched on” developer
And here’s where I get to the point of representation of development in social media and main media. It suffers from the same problem. We have a skewed image of what we should be as developers. And more and more people get depressed and feel bad because of it.
Just take a few of the following statements and for each of them that apply to you give yourself a DFBSP (Developer Frustration Bullshit point).
I feel like I’m falling behind in my knowledge as a developer
I am not working on cool new technology like everybody else does
I am worried that my skillset is getting rusty and I don’t know the things current employers are looking for
I have no side-hustle or project to fall back on if I lose my job
Modern development doesn’t look at all like what I do day to day
Everybody else knows more than me
It seems that there is a massive change in the development world happening and I can’t find a way to get into it or even get excited about it.
I am pretty sure you can nod along to at least one of these points. And I do feel the same. I have the benefit of having worked in this market for 25 years, and I’ve seen the same patterns emerge over and over again. But I also understand that people are anxious and worried. That’s terrible and we shouldn’t feel that way. One reason why we are like that is noise.
A change in developer videos
Lately with the pandemic I didn’t go to meetups and conferences any longer. Instead, I switched to video as a platform of educating and also learning about things. I don’t have to put up an effort to go to a place to learn about the bleeding edge. I can sit in my chair or lie in my bed and consume 24/7. Video as an education platform skyrocketed in the last years, because we had to work from home.
It is exciting to work with the Visual Studio Code team on shorts. These are 20-40 second videos for TikTok and subsequently YouTube. They are fun to do, although creating videos about development tools in portrait feels wrong.
I’m going to say it clearly: I don’t get TikTok. I look at it and I feel annoyed. I feel badgered and pushed and it isn’t surprising. This is exactly what the platform does. If we compare Facebook to a Skinner box, TikTok drives that up a notch. It is a perfect addiction machine, locking you in and making you stay. Consume, consume and consume some more.
That said, I was pleasantly surprised about the comments I got on media in that format. There was a lot of insightful and actionable feedback. It seems that by making information more “snackable”, you also get people to interact more. A 45 minutes talk video is overwhelming and feels like an investment to your viewers. It seems that the main consumers of these platforms use it differently than I do.
Looking at the developer video offerings, there is a disturbing fashion of being overly dramatic. I want to make it clear that I don’t criticise the content of any of the video channels shown here. I do like a lot of them, learned from them and really appreciate what they do. But I have a hard time taking the trend of video thumbnails serious.
I need to up my game with video thumbnails about coding stuff. It seems you need to look shocked/pensive/pleading/constipated to get people to learn when not to use a semicolon. I really like the content of these people but this just makes me cringe. pic.twitter.com/Ig8nSf3GE1
Sure, this could only be a simple way to get more clicks. And as everyone does it, it seems to work. But it also fuels stress and anxiety. If everything is super important and I don’t have the time to learn about it or even know about it, how does that make me feel?
The good news is that we have control over this. We can choose not to watch these videos or not to feel badgered by the click-bait nature of things. But when it comes to noise to deal with to do our job, the constant change in our platform is also tricky.
More granular access to the web platform brings more complexity
Web development as a job seems to be hard to grasp. We always have to deal with a few things.
Platform/Browser differences – there always seems to be one browser or platform that holds us back.
FOMO when comparing with native platforms – native, closed platforms will always seem better than the web, as they don’t need to cater to all
Constantly changing language features – looking at CSS two years ago and now is an amazing difference. JavaScript even comes in annual flavours now
Lag of documentation – the newest features often lack any official documentation. Instead you get a lot of presentations, videos and undocumented demo code
Everything is experimental – almost everything shiny and new comes with a lot of noise but also a tiny “don’t use this in production”
This isn’t new. This has always been the case with the web. And the way out of this is standardisation. The crux of the matter with that is that defining, ratifying and agreeing on a standard is a slow process. I remember talking some time ago to Molly Holzschlag when CSS got a lot of new standard features. Her complaint summed up the problem of the speed of design fashion and standardisation quite nicely:
It took us about a year to standardise how rounded corners in CSS should work. By that time web design fashion changed and nobody wanted them anymore.
To speed up the slow and academic standardisation process, developers demanded more access to the web platform. Thus, the extensible web manifesto was born, demanding more low-level APIs so that any developer can move the web forward. The first big improvement was to replace the flawed way to give web products offline capabilities, AppCache with ServiceWorker. Next we weren’t content with how some HTML elements created complex interfaces we had no control over. Web Components allow us to build our own interfaces that are an HTML element. The most recent change in this drive for more low-level access are CSS Houdini to use the CSS painting APIs, and Cascade Layers to control the CSS Cascade rather than having to blindly rely on it.
All this gives developers much more control over the web, but it comes with the cost of complexity. The beauty of the web was that it was relatively simple to get started. Write some HTML, add some styles to make it look and work great and then add JavaScript to add extra interactivity. With this new amount of access, we seem to have to be already skilled developers to build a small web project.
As it turns out, a lot of web developers aren’t that interested in getting granular control of the web. They are much more interested in getting work done. But having this low-level access does empower other developers to write abstraction libraries. These use the low-level APIs under the hood, but give those developers who want to just build something quickly a faster way to do so. If you, for example, look for ServiceWorker solutions, you will find that most people use the WorkBox library instead.
So, to recap:
Web development is complex as there are so many things to consider
Standards help bring order to chaos
Standardisation is slow
Let’s allow for programmatic access to the web platform
Biggest consumers of low level web APIs are abstraction libraries
Abstraction libraries aren’t standardised
See the problem? By abstracting away the issues of the web into hundreds of frameworks and libraries we created a similar problem than we had before. Except now developers starting with the web aren’t frustrated by the platform. They are drowning in an offer of lots of helpful abstractions and toolchains. And that makes web development look a lot more complex than it should be. Jacob Hands put it nicely on Twitter:
It is natural to feel overwhelmed by this much choice. Especially when each solution in this avalanche is supposed to make you more effective. It is time to take a break, a deep breath, count to ten and look at what’s happening.
The thing that Jacob is showing here isn’t the start of a project. It is months of agreement, trial and error and finding the best solution to build a certain product. The fallacy is then to think that every other product would also need the same toolchain to get off the ground. It makes no sense to overwhelm a single person with all these tools. It doesn’t automatically make you more productive. It can, but it also may be overkill.
If you don’t know what all these things do, we can start a club, because I don’t either. I am also not worried about it. Working for 25 years in the business taught me a few things. It taught me that sooner or later, tooling and choice of technologies will overtake you. And it taught me that our careers and jobs rely on other things – like how we work with other people.
Experience can be a burden
I wrote about this a few weeks ago already, but it is worth repeating. The more experience you have as a developer, the more insight you have into how things fail. The danger in this case is then to tell everybody else to avoid the problems you encountered in the past. To assume that the knowledge you have right now is as valid and obvious to others as it is to you. People who didn’t have the same experiences you had. We try to come up with a hive intelligence or knowledge by telling people what we know. Not by allowing them to make mistakes and thus understand why these solution make sense. Failure is a part of learning, but we keep trying to avoid it at any cost. Either by building solutions that abstract issues away, or – and this is where it really gets bad – by telling people off for not embracing our own experiences and wisdom as a given.
Avoiding destructive patterns
When it comes to noise and stressing developers out, there are a few patterns people follow that have to go away.
Gatekeeping
You aren’t a professional if you don’t use ${thing}
This is utter tosh. Over my career I’ve heard this dozens of times. In almost all cases the thing that would have made me a professional vanished in a few months. And got replaced by the next new shiny. I know highly professional developers working with woefully outdated tools and technology. Partly because their product demands it. But also because they are effective using it and don’t see any need to learn a different one.
Assumed baseline
You forgot to do the most basic things, you are horrible to $people!
This is one I struggle with a lot. Valid HTML, the most basic accessibility features and a readable syntax are second nature to me. Using all these makes sure you don’t block people out, and you make it easier for people to maintain and run with your work. But calling people out publicly for basic mistakes isn’t helpful at all. This is a pattern you see a lot in social media. Almost every positive post will have someone find a flaw in it that could offend a certain group. Pointing this out may be important, but it is also a major bummer.
Fear mongering
These are the only skills employers are looking for!
What engineering managers want from a new hire and what ends up in job ads differs a lot. This is a problem we need to deal with in our market. In almost any job I started in I had half the skills listed in the job description. It is never one killer technical skill that will make you stand out. It is how good you are in taking on new challenges and integrate into existing structures and needs. Companies don’t need rockstars, they need people who can integrate into a well-working system. That we list a plethora of skills that are hot right now in job ads is annoying.
Wisdom of the ancients
This never worked before and will fail now!
This ties in with my “Shut up old man” post and is a real problem. The longer you work in development, the more tainted you get. This slows down innovation and frustrates fresh, excited people around you. One big step towards becoming a tech lead is to use your experience to help people grow. Not to let your horrible memories taint possible great new things to come. Enthusiasm is never a bad thing when it is being channelled into useful actions. Often things that were impossible for me to achieve are no issue for new developers in an evolved environment.
My pet setup
Why don’t you use alpenhorn.js like real professionals?
I keep encountering this as comments from people asking to contribute to a project. It is reverse gatekeeping, telling me to earn their work by subscribing to their idea of a perfect setup. Even when the project in question is a decade old and has thousands of contributors. It is pure hubris to demand the product to change. A better way is to point out what benefits it would bring to reconsider a new architecture. That way you’ll learn soon why it isn’t that easy. For most projects, there is never any time for re-architecture, no matter how messed up they are. It is tricky and scary to replace an aircraft engine mid-flight.
Copying the big players
“This is used to build $bigproduct, so it will be even better for ours”
This fallacy is rampant. It is annoying how many projects are huge because they started with a “big player” bootstrap. Frameworks and libraries are great to get a project off the ground fast. They are also vital for companies with huge projects and hundreds of developers. So, if you want to create something quick and you know you will re-write it soon anyways, fine. If you think that using the products the big players use makes your product scale and grow as fast, good luck. Fact is, you hardly will ever build anything from scratch when a company hires you. Companies have budgeted training on the job to get people proficient in the tools they use. The idea of publishing these platforms to the world is to cut down the amount of training for new hires. Not to enable lots of competitors to work as efficiently.
Coping mechanisms
In addition to what to avoid, it might also be good to talk about a few coping mechanism to avoid stress and anxiety about falling behind as a developer. So, here goes.
Experimental features are important, but they should be treated as such.
One big mistake we make is that we want to use experimental features of the web platform immediately. This isn’t what an experiment is about. It is about people trying the new thing and giving feedback if it is good enough. Far too many libraries, polyfills and well-intentioned ideas to make tomorrow’s tech usable today are now digital landfill of the web. An experimental feature may be tomorrow’s tech, but it also might have to go back to the drawing board. Being an expert in something that is half baked is quite an investment you may not have to make.
What is important for your product is defined by your audience, not you.
It is frustrating to not be able to play with the newest and coolest all the time. As a developer, though, your job is not to make yourself happy. Your job is to give the users of your product the best experience. Keep the product performing well, not block out anyone because of their setup or abilities. And keep the product secure. If you build a working product that does this, you’re already a kick-ass developer in my book. This is enough to cover and the technology stack to do that is often governed by the needs of your users.
If things sound too good to be true and fix all problems magically, they are too good to be true.
Don’t fall for false promises – there’s always a catch that is well disguised in good marketing.
Remember that every video, every post and every talk has an agenda.
Even this one. I kind of wrote this for myself, to calm myself down. If you watch, read or listen to something that makes you feel like you are missing out, check who delivered it. In 99% of the cases you’ll find there is some product or service involved. Or, it may be the “subscribe now for more” to make you give them more clicks.
Aggressive feedback is often there to cover up feelings of inadequacy in the person who gives it (still, hard to cope with).
There is a lot of anger in technical online discussions and comments. Over the years I found that the loudest and most aggressive people aren’t out to get me. They are out to get what I represent to them. They want to be the people who are considered to be the movers and shakers. Anyone disagreeing or trying to calm things down are in their way to greatness. It is tough to not take this personal, but it also means you feed energy into a lost or misguided cause. Much like you stop a dog from barking by showing less interest and radiating calm, you don’t get anything from shouting back.
Count to 10, breathe in, breathe out, dare to think slower…
Fast thinking is a thing we cherish. We love people that come up with brainy sounding quick solutions and “think on their feet”. It makes us feel like innovators and driving the agenda. The issue with it is that if all thinking is fast, a lot of opportunities to create great things fall by the wayside. The first thing that comes into your head may sound obvious, but there is a lot of good in reflecting the obvious, too. Also, not every discussion is worth plunging into and the most heated ones often aren’t at all.
Good ideas to calm things down
One thing to get less noise is to stop adding to it. By avoiding the earlier mentioned destructive pattern we call can help. Another thing that is easy to do is not to post or to answer when you think you need to. It is amazing how much less stressful your social media feed gets when you don’t add to it all the time.
One other thing that works wonders is to do something instead of telling someone to do it.
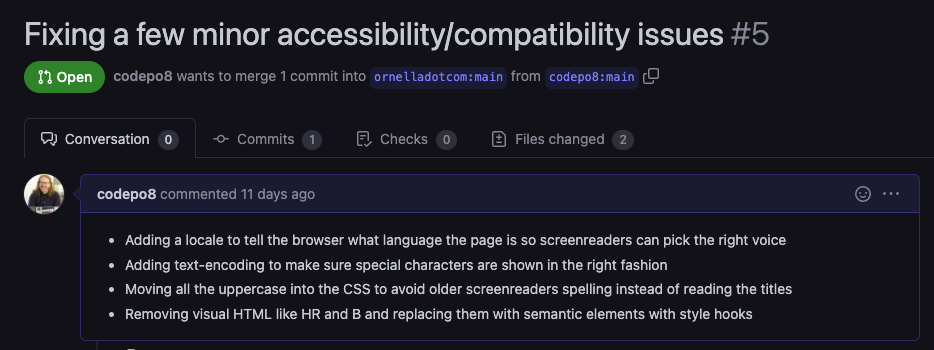
The other day was VS Code day and the five minute “create your own web resume” presentation by Ornella Altunyan blew me away. In it, Ornella shows how to build a web resume in the browser without installing anything on your computer.
The HTML and CSS used in that demo triggered my “wisdom of the ancients” antipattern. A few important things were missing and it was tempting to point those out.
But instead of doing that, I checked if the code is available for contribution, and it is. So I forked the code, played with it, fixed the issues that ailed me and created a pull request. In this one I explained why I consider these changes important and that’s that.
As we work in the same place, I also pinged the author and thanked for a great presentation. I learned that my changes and explanations were highly appreciated. I also learned that integrating them might take some time. The code is part of a workshop and a learning module and these materials need to get adjusted accordingly.
Excellent, isn’t it? I got to calm down by fixing some things and playing with some new technology. The author has code to merge with explanations and I learned why my contribution might take some time to show up. No unknowns, no pushing and complaining. This is fun.
In general, it is temping to complain in public but it isn’t as useful as we think. All it does is create noise and give people extra work. So, before we go to Twitter to right some wrong in a piece of code, it might be a good idea to do this instead.
Check for official feedback channels and use those (bug trackers, in-built feedback items, code repositories)
Search if the problem is already reported and upvote/comment instead of creating a duplicate – the more people report on the same thing with more detail, the easier it gets to fix
If you are reporting a problem, create a good explanation how to replicate your issue.
Include your setup, often some third party influence can cause the issue.
Often you find by re-doing what you did and documenting it, you find an own mistake and learn that the product isn’t broken at all.
I’m forcing myself to be calmer, to care less about things being “obviously wrong” and to listen more intently. And to block out unnecessary noise. If you do the same, you’ll find being a developer in today’s world is pretty darn amazing and that what you know is already a lot – and maybe enough.
Posted in General | Comments Off on Noise cancellation for development
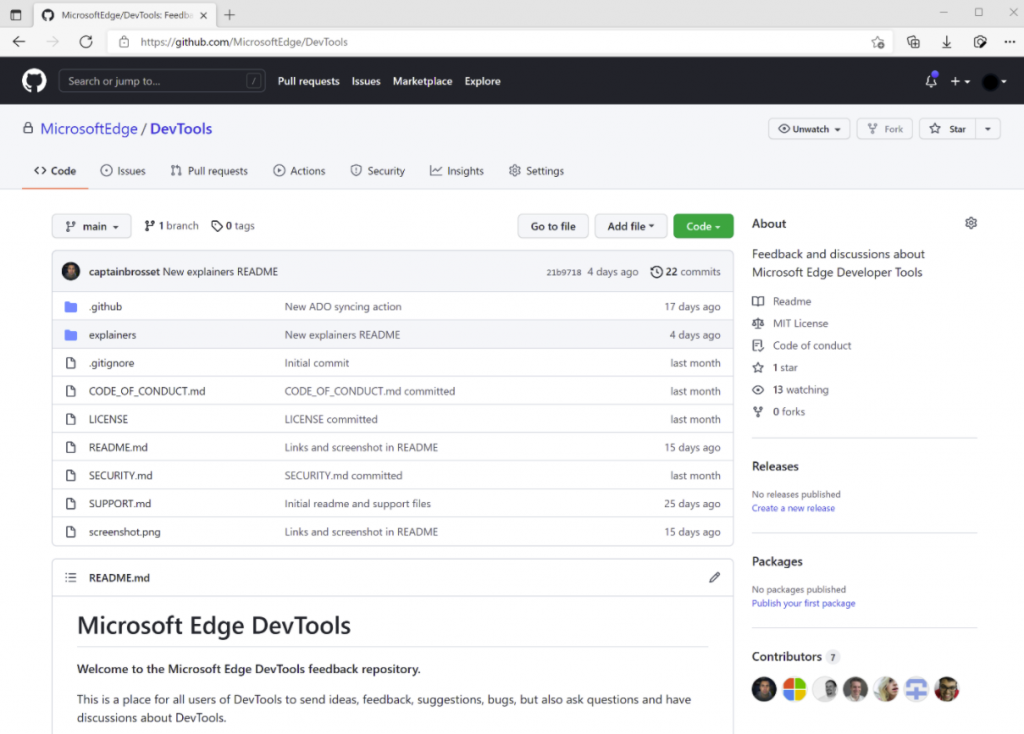
There’s an official blog post on the Microsoft Edge blog but here’s why I am excited about this.
When I joined Microsoft, I really wanted to keep everything I do open source and allow people to contribute. This is a big step to make the Developer Tools more open.
I spend about an hour a day triaging the feedback we get in Developer Tools via the feedback icon in the tools themselves. Of the ~400 items I get in my shift, about 5-10 are on topic. Others are about the browser all-up, or just about all kind of things people want to do on the web. This should focus it much better. We still keep the other feedback channels open, but I do like the idea to talk to developers first and foremost when it comes to Developer Tools.
Posted in General | Comments Off on Want to improve Developer Tools in Microsoft Edge? File an issue on Github
I just encountered a sneaky thing I had not seen, although it probably worked in 1999 already. A web site was showing a different title on the tab, depending on it being active or not.
The whole trick is to use the blur and focus event handlers on the window to change the title.
window.onblur=function(){
document.title='Please come back!';}
window.onfocus=function(){
document.title='You have 6 items';}
You could also change the Favicon that way. Maybe this is a common practice and it feels pretty spammy, but there may be some good use cases for it, too.
If you don’t want to clobber other events, it is better to use `addEventListener`:
let activeTitle ='You have 6 items';
let inactiveTitle ='Please come back';
document.title= activeTitle;
window.addEventListener('blur', e =>{
document.title= inactiveTitle;});
window.addEventListener('focus', e =>{
document.title= activeTitle;});
let activeTitle = 'You have 6 items';
let inactiveTitle = 'Please come back';
document.title = activeTitle;
window.addEventListener('blur', e => {
    document.title = inactiveTitle;
});
window.addEventListener('focus', e => {
    document.title = activeTitle;
});
Posted in General | Comments Off on Showing different titles depending if the tab is active or not