A launch.json setting for end-to-end web development
Wednesday, January 26th, 2022 at 7:10 pmWhen I start a new project these days I create the following launch.json file and put in in a .vscode folder on the the root of my project.
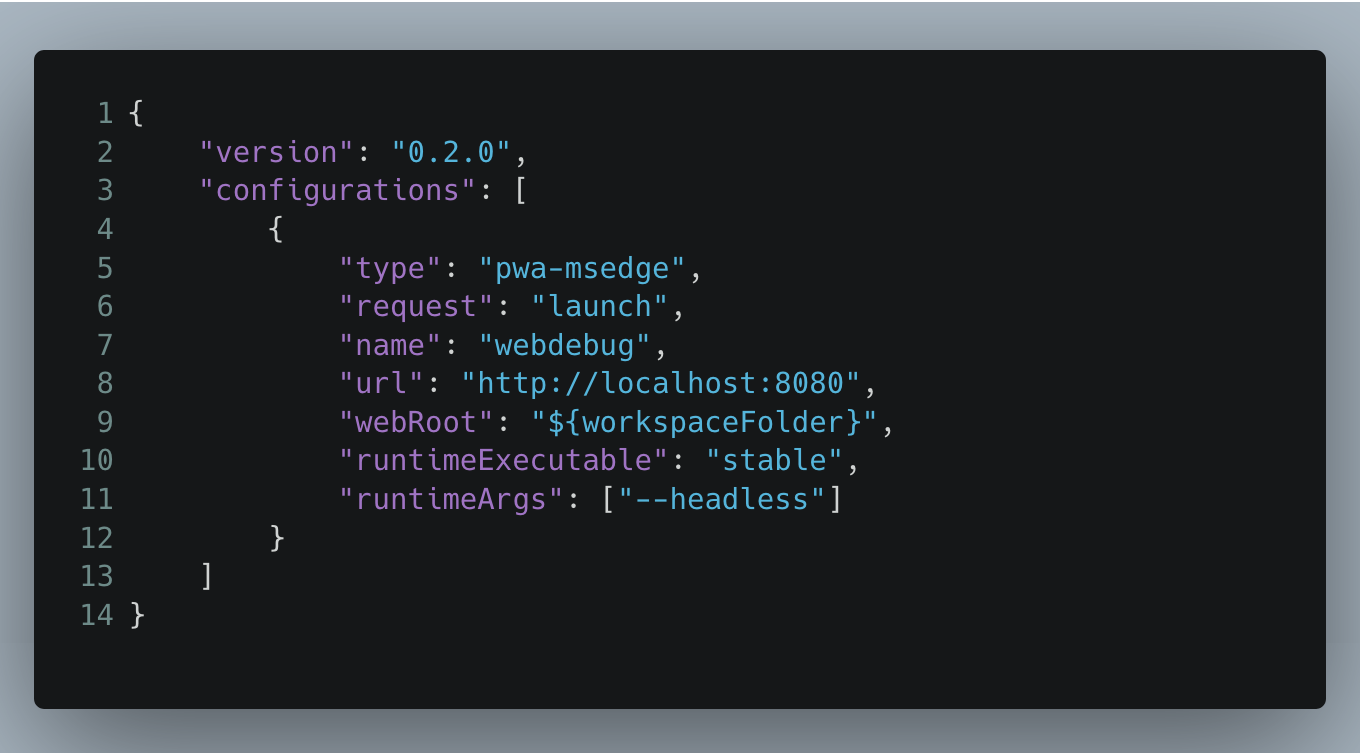
This turns Visual Studio Code into an environment that gives me everything I need to build a web product without ever leaving it. If you want to try it out, you can use my bare bones vanilla JS ToDo app as an example, which already has the correct launch.json.
Step 1: Using the built-in Terminal
Visual Studio Code has a built-in Terminal that allows you to start a server. You can also run build scripts or do version control here. Although the in-built version control is probably more convenient.
Step 2: Starting a browser debug session
Activating Run and Debug and starting the debugging session opens a dedicated browser instance for this project. This means you get a pristine, clean browser every time. You can of course also go to localhost:8080 in any other browser if you need to rely on extensions or login data. You can see that the debug session is running as the debug toolbar appears and the lower border of the editor changes colour. In my case, from blue to orange.
Step 3: Opening the developer tools
Activating the Developer Tools icon opens the browser developer tools inside Visual Studio Code.
![]()
You can now do everything you can do in the browser, but without leaving the context of the editor. This allows you to do the changes in your DOM and CSS using the developer tools next to the source code.
Step 4: Opening the screencast
Activating the screencast button gives you a new panel inside Visual Studio Code showing the browser rendering. This is an interactive browser window and you can move the screencast tab anywhere you like in Visual Studio Code. You can also emulate different mobile environments and the browser will set the correct User Agent and simulate touch interfaces.
Step 5: Using the features
Once this is all running, you have all the features I need to build and debug my web project. you get:
Full two-way interaction between the developer tools and the source code.
If you change the CSS of an element, VS Code will jump to the correct file in your project and replicate the changes there. It will not automatically save the file. This is to prevent automatic triggering of build scripts and you probably want to try a lot of changes before you reach your desired outcome. The changes do show up live in the screencast though.
Inline linting of your code.
If there is an issue with your code, Visual Studio code will add a squiggly underline to it. You can then roll over that code and get information why it is a problem and how to fix it. If you write code, it gets automatically checked and you get a message that something is wrong and how to fix it. You can also use the Problems panel to see all the problems in the project.
Browser Console in Visual Studio Code
The debug console in Visual Studio Code is now your browser developer tools console. You can see your console.log() messages there. You have full access to the window object and you can use the DOM convenience methods and shortcuts.
Breakpoint Debugging
As you are in a debug session you have full breakpoint debugging. You can set breakpoints, interact with the project and you can go through your script step by step. You get inline information as you step through it and the execution halts while you analyse what’s going on.
Closing the debug session closes the browser
Once you are done, you can hit the stop button in the debug bar and everything goes back to square one. No need to close browser windows or developer tools sessions.
Anything missing?
We’re working on a few more improvements for this that will go live in the next few versions. Specifically we’re working on:
- Sourcemap support to debug Sass/Less files
- Filtering options for issues reporting
- Automated fix suggestions
- Integration into Visual Studio
If you have any good ideas, feel free to reach out to me or file an issue on the official GitHub repository.