It is not that hard to create a script that shows and hides parts of the document, but often we forget about how our visitors use the products we build. Especially when it comes to navigating huge documents, people tend to use the “find in page” functionality of browsers. And when they do and we hid content with JavaScript, browsers would either not find the content or users won’t know where in the document it is.
If you use the HTML elements of summary and details you don’t have to write any show/hide code yourself and users of Chromium browsers (Edge, Chrome, Brave…) can use “find in page” as the browser will automatically expand the details that contain their search terms.
You can see this in action on any page that uses the elements. For example on this W3C document you can open the Developer Tools and see the browser add the “open” attribute to the detail in question when the term was found inside the details.
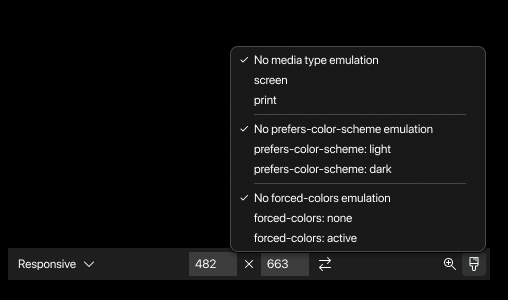
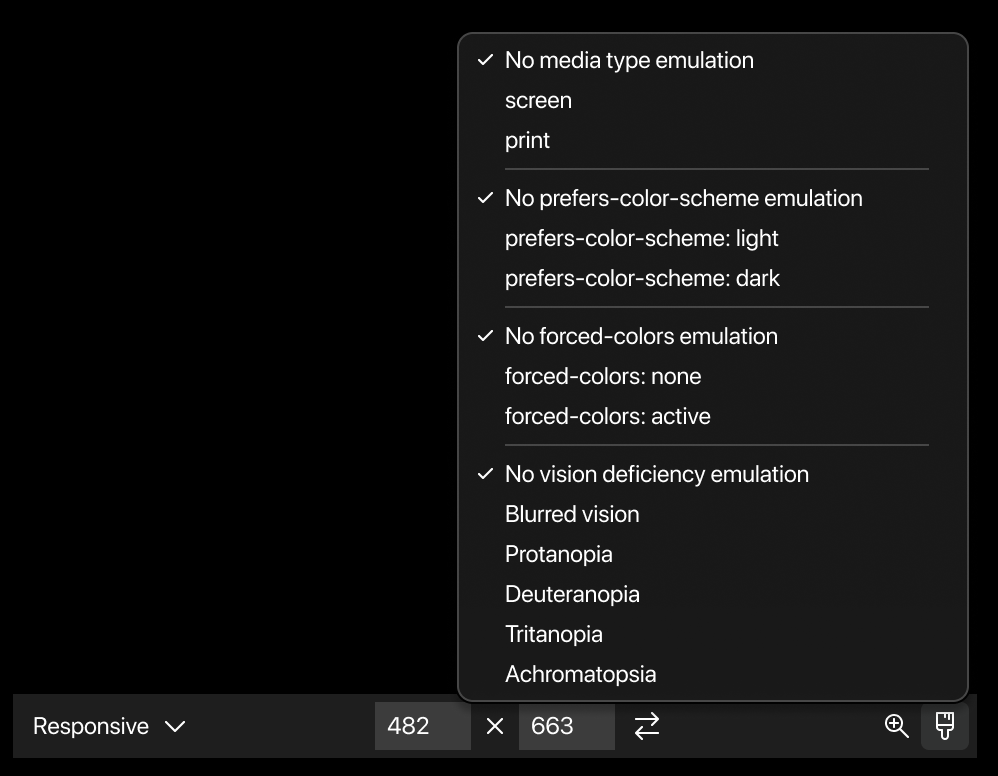
If you don’t, then the problem is that they are hard to find and hidden in the `Rendering` menu.
To improve this, we are working on a new emulation bar inside the screencast of the Edge DevTools for Visual Studio Code as a testing ground to change it in the main browser.
We just released version 1.4.6 of the Edge DevTools for VS Code extension and the main change is that the Console tool is now available in the extension.
There are two caveats at the moment: in order to see the Console, you need to use Edge Canary as your debugging target (version 101.0.1193.0+) and it can happen that the you need to refresh the target once to see the Console light up. This is a bug in VS Code itself and will be fixed in the upcoming version.
New automatically created `launch.json` settings
To give you the best debugging experience in VS Code, we updated the `launch.json` settings when you generate it from the extension. The new file offers you a headless debugging experience by default calling the correct version of the Edge debugger.
You can see it them in action in the following screencast:
If you want to see the Console tool right now and not until 101 is the stable version of Edge, you need to add a `”runtimeExecutable”: “canary”,` to the launch.json to target the Canary build of the browser.
We add two more lines to the existing `launch.json`, defining a task to run before debugging starts and one after it end. Let’s call them `start server` and `stop server` respectively:
Tasks are meant to run, have an end and then tell the debugger that they are ready. Normally you would, for example, use them to do some conversion or pull some information. In this case, it is a bit trickier, as we start a server and that doesn’t give us any feedback. The task never ends as the server starts and keeps running.
The `start server` task is a `shell` task, should run in the background and the command it executes is `http-server`, which is the NPM module of the same name. The presentation property is set to silent, which means that when the server starts, it doesn’t pop up the terminal in Visual Studio Code. When we use background tasks, we need to define a `problemMatcher` that tells the debug process if the task has executed successfully or if there was any issue. This can get rather complex and you need to parse the output on the Console with Regular Expressions. In this case, we keep it very open and allow anything reported on the output Console to be a success (RegEx “.”).
What this task does is open a new Terminal, enter “http-server” and hit enter for us. And once that’s done, we have a local server at our disposal, making the current Workspace folder available as `localhost:8080`, which is also what we defined in our `launch.json` as the address to navigate to.
The `stop server` task is a bit simpler. we just make it send a `terminate` command to the terminal. We then use an `inputs` directive to define the `terminal` CLI command as something that calls `workbench.action.tasks.terminate` with an argument of `terminateAll`. This closes any Terminals opened by tasks earlier.
And that’s all there is to spawn a new local server when you start debugging and close it when the debug session ends.
There is currently a bug in VS Code, that throws an error in your tasks when the `Problems` pane is not empty when the task runs. In the case of using the Edge Developer tools for VS Code extension that means any issue reported there will result in this problem. I reported this to the team and they are working on a solution.
If you want to see this in action, you can fork the simple to-do demo and run it locally. Make sure to have http-server installed via NPM.
Posted in General | Comments Off on Automatically starting a server when starting a debug session in VS Code