Christian Heilmann

Reason #21312 to build accessible data tables – convert them directly to YUI flash charts!

Thursday, January 17th, 2008 at 6:11 pm

Following up the success of the data table to Google chart post, and the request in the comments to do the same for YUI charts, go and check the YUIblog today (like, now) and get your fix there:

example of how the script creates a chart above a data table from the table data

The elevator pitch:

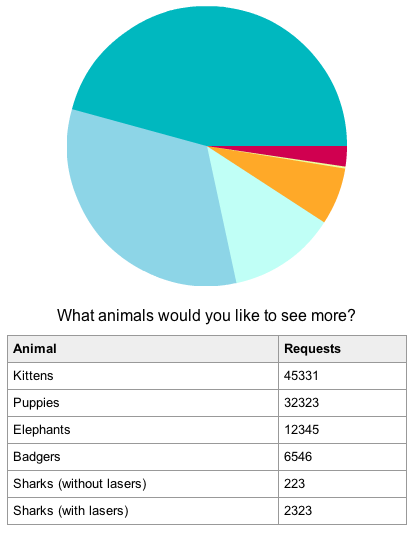
  • Create a valid HTML data table
  • Add two script tags to the body and a class to each table
  • Have tasty pie charts above each of the tables

Tags: , , , ,

Share on Mastodon (needs instance)

Share on BlueSky

Newsletter

Check out the Dev Digest Newsletter I write every week for WeAreDevelopers. Latest issues:

160: Graphs and RAGs explained and VS Code extension hacks Graphs and RAG explained, how AI is reshaping UI and work, how to efficiently use Cursor, VS Code extensions security issues.
159: AI pipelines, 10x faster TypeScript, How to interview How to use LLMs to help you write code and how much electricity does that use? Is your API secure? 10x faster TypeScript thanks to Go!
158: 🕹️ Super Mario AI 🔑 API keys in LLMs 🤙🏾 Vibe Coding Why is AI playing Super Mario? How is hallucinating the least of our worries and what are rules for developing Safety Critical Code?
157: CUDA in Python, Gemini Code Assist and back-dooring LLMs We met with a CUDA expert from NVIDIA about the future of hardware, we look at how AI fails and how to play pong on 140 browser tabs.
156: Enterprise dead, all about Bluesky and React moves on! Learn about Bluesky as a platform, how to build a React App and how to speed up SQL. And play an impossible game in the browser.

My other work: