Github Next now showed a new feature in GitHub Copilot labs that allows you to change code you write to make it cleaner, more robust and document it automatically.
GitHub Copilot is incredible, and if you check what’s happening in the preview released as the Copilot Labs extension it will only get more amazing.
Check this out:
Let’s start with a basic JavaScript that checks a string length and reports when it is empty. One with an obvious mistake, as we use a single `=` instead of the type safe `===`. This will always report the string as empty.
if(str.length=0){
console.error('String is empty');}
if (str.length = 0) {
    console.error('String is empty');
}
Using the `Fix bugs` brush, this is rectified.
if(str.length===0){
console.error('String is empty');}
if (str.length === 0) {
    console.error('String is empty');
}
Using the `Clean` brush also adds reporting when the string is not empty.
if(str.length===0){
console.error('String is empty');}else{
console.log('String is not empty');}
if (str.length === 0) {
    console.error('String is empty');
} else {
    console.log('String is not empty');
}
Using the `List steps` brush adds comments for step (sure, this is redundant, but it also works for much more complex code).
// check the length of the stringif(str.length===0){// if length is 0, print 'String is empty'
console.error('String is empty');}else{// if length is not 0, print 'String is not empty'
console.log('String is not empty');}
// check the length of the string
if (str.length === 0) {
    // if length is 0, print 'String is empty'
    console.error('String is empty');
} else {
    // if length is not 0, print 'String is not empty'
    console.log('String is not empty');
}
Using `Make robust` adds error reporting instead of logging and an extra check to make sure that `str` is really a String and not an empty Array.
function test(str){if(str.length===0){thrownew Error('String is empty');}elseif(typeof str !=='string'){thrownew Error('It is not a string');}else{
console.log('String is not empty');}}
function test(str) {
    if (str.length === 0) {
        throw new Error('String is empty');
    } else if (typeof str !== 'string') {
        throw new Error('It is not a string');
    } else {
        console.log('String is not empty');
    }
}
The `Add types` brush does exactly that.
/**
* @param {string} str
* @returns {string}
*/function test(str){if(str.length===0){thrownew Error('String is empty');}elseif(typeof str !=='string'){thrownew Error('It is not a string');}else{
console.log('String is not empty');}}
/**
 * @param {string} str
 * @returns {string}
 */
function test(str) {
    if (str.length === 0) {
        throw new Error('String is empty');
    } else if (typeof str !== 'string') {
        throw new Error('It is not a string');
    } else {
        console.log('String is not empty');
    }
}
You can also define custom brushes and there are more to come.
Posted in General | Comments Off on Code brushes for GitHub Copilot
I was interviewed by Jay from Moduscreate to talk about my past, how I got into the market, what open source and browser compatibility means for me and many other bits. Amazing to see that we chatted for 1.5 hours and I hope some of it may be inspiring to you.
Using overrides in Chromium DevTools you can cache static assets locally and you don’t need to wait for GitHub pages to build before seeing a change in your scripts or styles.
GitHub Pages are a great offer. You can host and version control not only your code on GitHub, but you can also turn it into an HTML page that people can see in their browsers even if they don’t have a GitHub account. All you need is to turn on Pages for your repo and any markdown files already get shown as HTML documents. You can add a `_layouts` folder with a `default.html` document and any markdown file gets shown using this one as a template.
The only problem you will face is that it always takes a while to generate the new pages. You can check the `Actions` tab on GitHub to monitor the progress, but it can get tiring to wait for the yellow spinner to turn into the green checkmark.
Especially when there is no build process necessary. Turning markdown documents into HTML with Jekyll support is worth waiting for, but it is annoying that a simple CSS change also means you have to wait for the build to successfully conclude.
This is why I use Overrides to work around that problem.
Say I want to mess with the CSS of Dear Console without wanting to wait for builds, here’s how I do that:
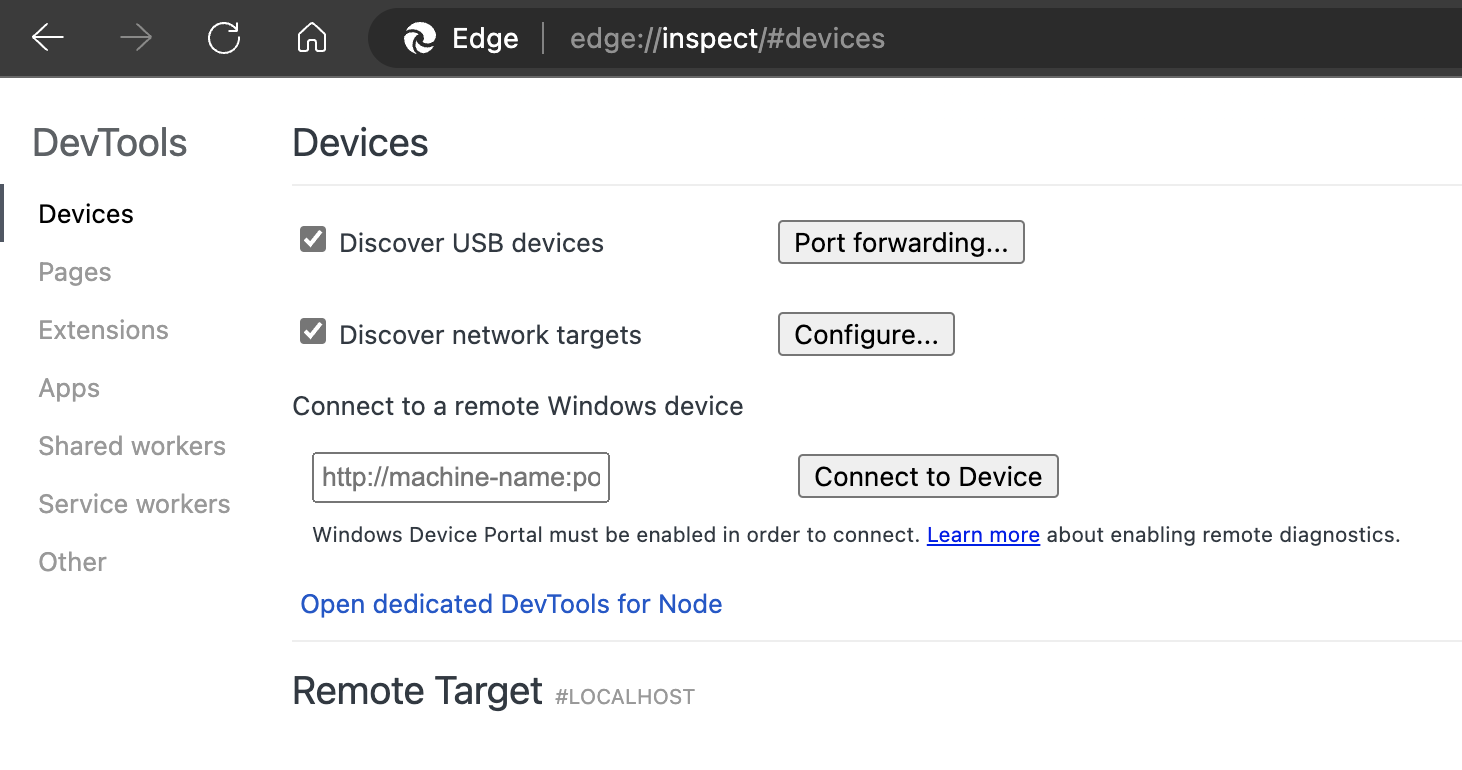
I select the arrow down to show more tabs and choose “Overrides”
I activate the “+ Select folder for overrides” button and pick a folder from my hard drive.
The browser asks me for file access to the folder. I choose the “Allow” button
Now this is the overrides folder for my browser. I only need to set this once – from now on, this is where files I want to override live.
I can now go to “Page” and select the files I want to store in this folder. I right-click any file I want to override and select “save for overrides”.
This will add an indicator to the file icon showing me that this file is now overridden.
The file is now on my hard drive in the folder I specified.
I can edit the file there, and when I reload the Github page, my browser will load the files I have on my hard drive instead of the ones from GitHub.
If I now open this file in my editor and change it, saving it will refresh my browser and I can see the style changes.
Overrides work with any web site out there, and are – to me – a really underused power tool to mess with the web and not waste our time waiting for builds to finish.
Posted in General | Comments Off on Stop waiting for GitHub pages to build using overrides
Sometimes you want to notify a user that something has happened in your application. To be as inclusive as possible, it is important to display these notifications close to where the action happened. Here is how to do that with plain javascript.
When something happens in an application that has no direct visual outcome, it makes sense to tell the user with a message that it happened. One example where I implemented that lately is the Dear Console,… project. When you activate any of the copy icons, you get a message showing right where you were that the text is now copied into your pasteboard.
This is a pretty common task, but often you see implementations that forget some basic aspects of accessibility. Pretty common are notification bars on top of the screen or a toast message bottom right. The problem with those is that you assume that people can see the whole screen. But there is a large group of people that only view a small section of the screen, either because they use a mobile device, or because they need to zoom in to interact with your product.
This is why it is important to give the feedback message right where the interaction happened. There are several ways to achieve that, and here is one that I found generic enough and sturdy in its implementation. You can see it in action in this codepen .
The first thing most people would do to position an element where the interaction happened is to read the mouse position and display it accordingly. This fails because of two reasons: first of all, not everybody uses a mouse and secondly, reading the mouse position in a world of positioned elements, scrolling interfaces and documents in iframes is complex.
Better: reading the position of the target element
One of the more “this is a mouthful” DOM methods is element.getBoundingClientRect , but it is incredibly useful. It gives you the location of an element in the document and its dimensions as an object
You can use this to position another element right next to the current one by reading the `top` and `right` properties. If you use an element that is keyboard accessible, like a button or a link, this means you can support all kind of users. In the case of this demo, we use buttons.
We position the notification message as `fixed` on the screen and give it a `left` and `top` property. To make things smoother, we also add a transition. As the values of left and top we use CSS custom properties. These we will get later on from JavaScript and the `getBoundingClientRect`. As they are without the ‘px’, we need to use `calc()` to tell CSS what to do. We position the message off-screen (`top` as `-20em`), and move it to the element position when there is `copied` class on a parent element. This allows us to keep all the styling in CSS. JavaScript is only needed to get the values and to add and remove the parent class.
Showing, hiding and positioning the message with JavaScript
The script to make the rest happen isn’t too complex. You can see it in its entirety here with comments on what the code means.
// hide the message after 1.5 secondsconst timeout =1500;// create an element with the class popup and add it to the// documentconst body = document.body;
let copypopup = document.createElement('output');
copypopup.classList.add('popup');
copypopup.innerText='☑️ Copied!';
copypopup.tabIndex=-1;
body.appendChild(copypopup);/*
When someone clicked one of the buttons
add a class of `copied` to the document body.
Undo this after 1.5 seconds
*/
let copythis = elm =>{
body.classList.add('copied');
setTimeout(()=>{
body.classList.remove('copied');}, timeout);}// If there is a click on the body element
body.addEventListener('click', e =>{// test that there is currently no active messageif(!body.classList.contains('copied')){// get the element the click happened on and // ensure it was a button
let t = e.target;if(t.tagName==='BUTTON'){// get the position of the button and set // two CSS custom properties accordingly
let x = t.getBoundingClientRect().right;
let y = t.getBoundingClientRect().bottom;
let root = document.documentElement;
root.style.setProperty('--element-x', x);
root.style.setProperty('--element-y', y);// call the function to show the message
copythis(e.target);}}});
// hide the message after 1.5 seconds
const timeout = 1500;
// create an element with the class popup and add it to the
// document
const body = document.body;
let copypopup = document.createElement('output');
copypopup.classList.add('popup');
copypopup.innerText = '☑️ Copied!';
copypopup.tabIndex = -1;
body.appendChild(copypopup);

/*
  When someone clicked one of the buttons
  add a class of `copied` to the document body.
  Undo this after 1.5 seconds
*/
let copythis = elm => {
  body.classList.add('copied');
  setTimeout(() => {
    body.classList.remove('copied');
  }, timeout);
}

// If there is a click on the body element
body.addEventListener('click', e => {
  // test that there is currently no active message
  if(!body.classList.contains('copied')){
    // get the element the click happened on and
    // ensure it was a button
    let t = e.target;
    if (t.tagName === 'BUTTON') {
      // get the position of the button and set
      // two CSS custom properties accordingly
      let x = t.getBoundingClientRect().right;
      let y = t.getBoundingClientRect().bottom;
      let root = document.documentElement;
      root.style.setProperty('--element-x', x);
      root.style.setProperty('--element-y', y);
      // call the function to show the message
      copythis(e.target);
    }
  }
});
Possible enhancements
There are still a few things we can do better. For one thing, we still are in a visual context here. Users of assistive technology like screenreaders who can’t see what’s going on, don’t get any information that we successfully copied something to the clipboard. In the following recording the buttons are announced but the interaction with them doesn’t say anything about the notification.
This fixed codepen example works around this problem by using an `output` element in the source and changing its value.
This makes it work with screenreaders. Interacting with the buttons now announces the text of the notification and what was copied.
The last thing I am not sure about is to automatically hide the notification after an amount of time without giving a user to prevent that is the best way. Got an even sturdier solution? Please comment!
Posted in General | Comments Off on Positioning notification messages with accessibility in mind


</p)

