Rethinking Device Emulation in browsers
Wednesday, July 20th, 2022Device Emulation in developer tools is great, but it doesn’t deliver to all users of it and could be much better. Please help us improve it.

When developer tools of browsers came out with Device Emulation and reponsive design tooling , everything changed.
As a developer, you didn’t need to resize the browser window any longer to see how your designs changed. You also had a way to test what your product may work like on a mobile device.
Testing on phones isn’t fun. You either have to tether to the phone, and get performance delays, you need to publish your product to an available server, or set up a tunnel to your local server on your computer that the phone can access.
This is why developer tools have device emulation. You can simulated different devices, rotate them, and you even get touch emulation, which is great to find out that the hover effect you love so much is pretty much inaccessible to most of your users.
Now, a few years in and with advancements in the devices space, the tooling we have starts to be inadequate to the needs we have. It seems we need to re-think the tooling we have to embrace a larger world of devices and a bigger audience.
I work as a product manager on the browser developer tools of the Microsoft Edge browser and I get roughly 400 feedback items a day of people using the browser.
Not every user of emulation is a developer
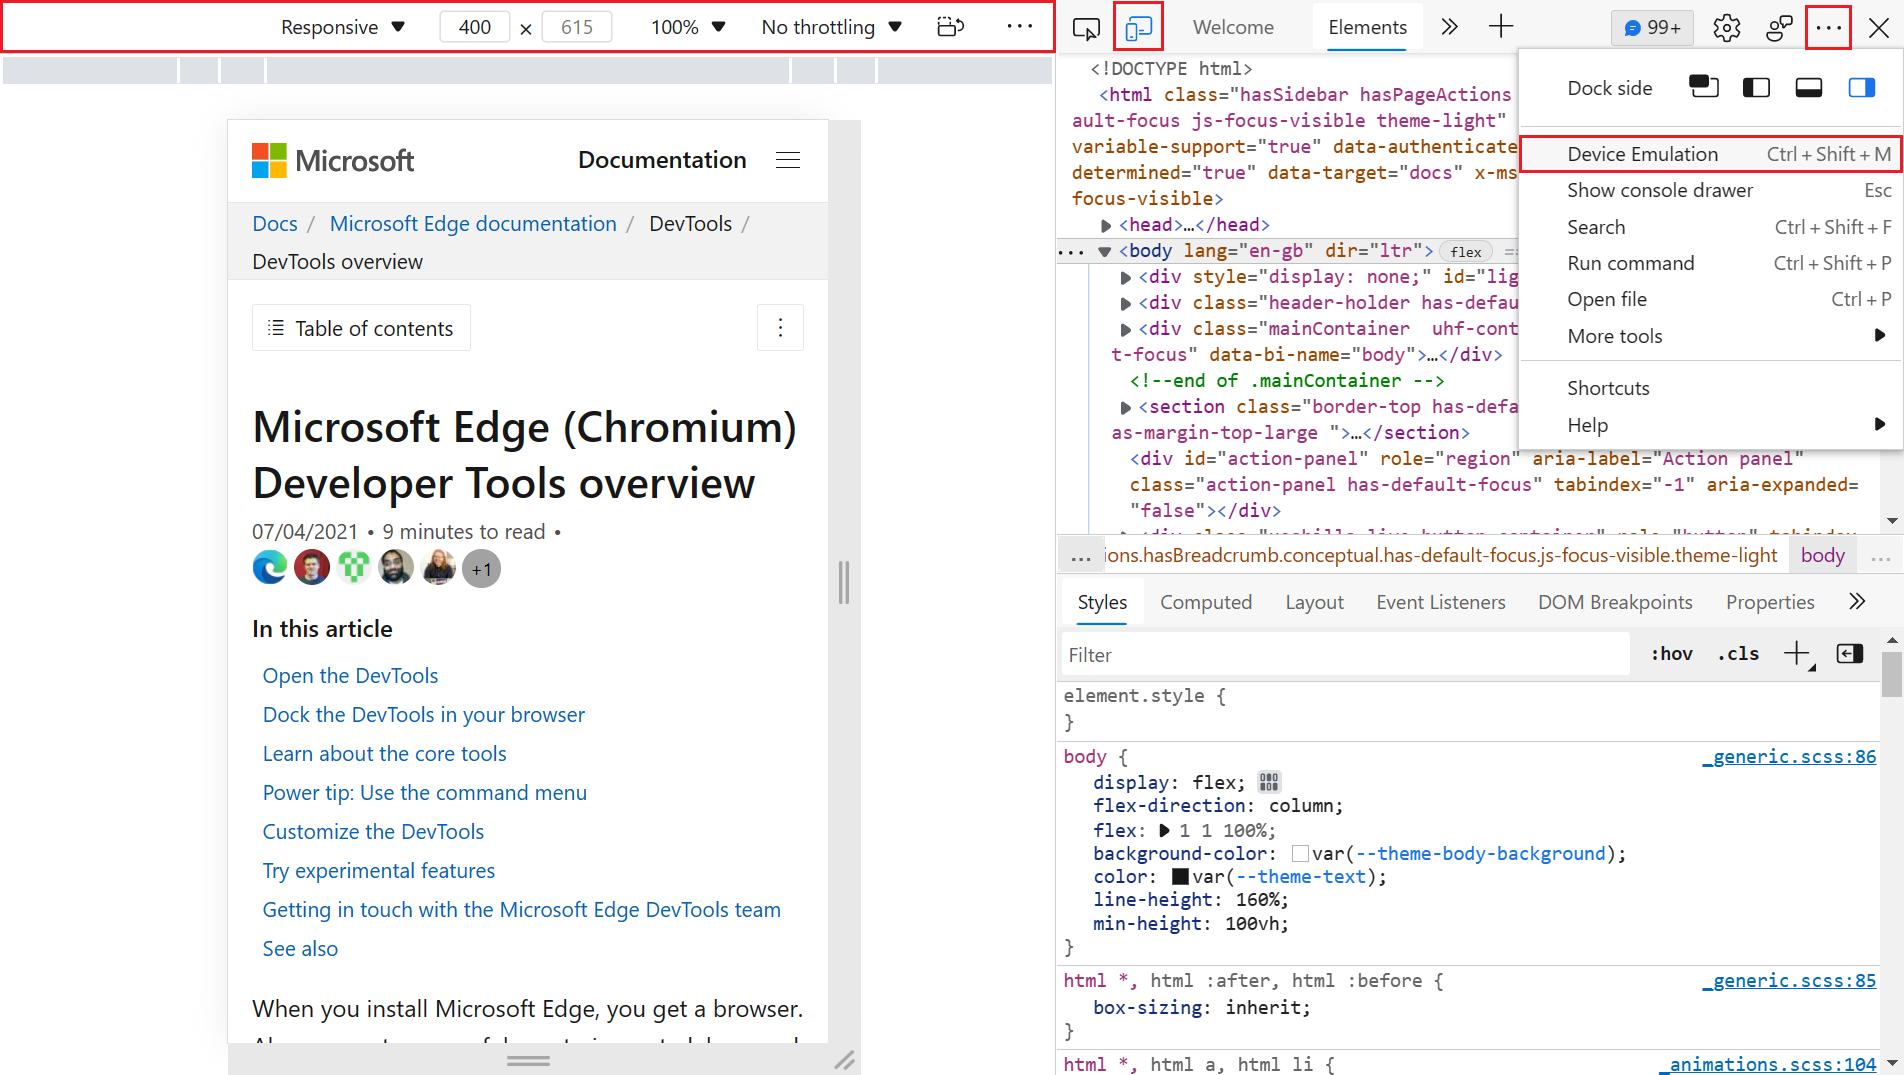
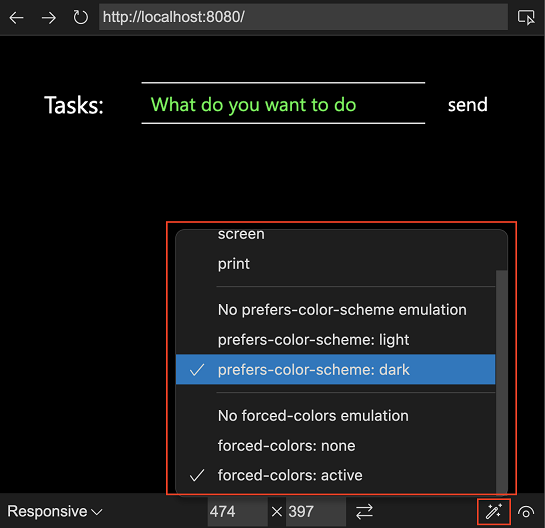
As a developer, I am intimately familiar with developer tools. I love that I can emulate different devices and states and use the tools to fix issues I encounter. I am, however, frustrated that the emulation parts are scattered all over the tools. Some are in device emulation, others are in the rendering tool and yet others are part of the Elements/Styles editor.
As a PM I get dozens of messages a day that people are freaking out about the complexity of those things and why someone is “hacking my computer” or “showing lots of errors I couldn’t have caused and don’t know what to do about”.
This makes me wonder what we could do to disconnect the emulation part of developer tools from the tools themselves. Following I’ll discuss a few things I encountered and point out problems the current implementation of the tools have when it comes to delivering to the needs of different users.
Emulation needs for non-developers
I get requests from people who love to use the emulation features to test products they themselves don’t work on. These are testers, project managers, designers and similar people who want to verify that their products work, but don’t need to work on the code or fix them themselves.
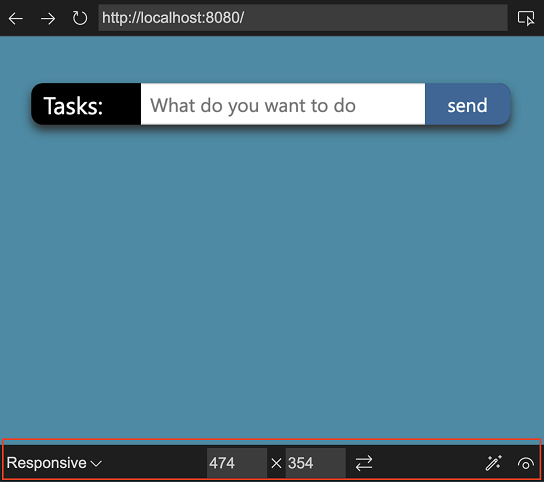
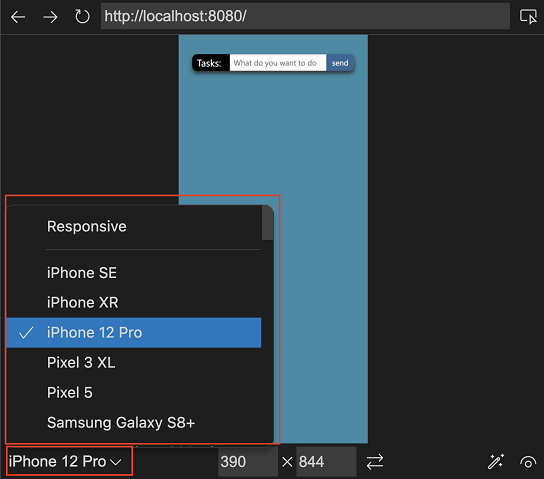
These people have the issue that developer tools take up a huge part of the screen without giving them any functionality they want. This is increasingly problematic when you simulate high resolution devices and work on a laptop yourself. As developer tools take up quite some space of the browser, the simulated devices will have to get zoomed out to a level where it isn’t quite as usable as you’d like it to be.
If you have a second monitor, you can undock the developer tools to that one, but it is pretty amazing to learn how many people never realised that this is even an option.
Users like these would like to have:
- Device emulation in the browser without developer tools taking up a lot of space
- A simple way to emulate different states of the product (dark/light mode, slow connections, low end device performance)
- A simple way to view a device around the content and take screenshots of that
- A simple way to annotate issues they found and maybe file bugs with their development team
These are all spot-checking tools and don’t need perfect emulation. But it would be great to use these without any extra efforts.
Emulation users that want to game the web
One other interesting group I found in feedback are users who emulate mobile devices to get a better experience of the web or access functionality they don’t get in the browser. The main use case is services like Instagram that only allow for uploads from a mobile device and not from a computer. As a lot of people are on metered connections on their mobile device they use the emulation to upload images from their computer. Furthermore, mobile versions of web sites tend to be slimmer, easier to use and not full of popups and demands to sign up for services and the like. Many video sites also use a native HTML5 player on a mobile interface instead of one with lots of interaction and popups. This allows you to save videos in an easy fashion.
Users like these normally don’t need Developer Tools, so they’d also benefit from a simpler way too get into emulation mode.
Possible changes to the emulation experience
The main difference I am proposing is that the emulation experience should be independent of Developer Tools.
The Microsoft Edge Extension for Visual Studio Code currently features a screencast with an own toolbar that offers such functionality. In addition to easier access to emulation, it also allows to see the product in different themes and emulate accessibility issues.
Firefox also has an emulation bar that is available independent of Developer tools being open.

The question now is how would a user turn on this emulation without opening Developer Tools? Firefox has a keyboard shortcut, but these are hard to get people to adapt.
Emulation concerns
One big problem we also need to solve is to manage expectations. Any emulation we have right now only shows webviews with the dimensions of different devices and a simulated touch mode. You can also simulate flaky connections and rotate the devices. You do, however, not see how the device would show the product as any emulation still uses the browser it is built in to display it.
This is especially problematic with iOS devices, which use a different rendering engine and emulated devices are very likely to give you a false impression that everything works. The more closely we emulate the experience (simulating notches, padding issues, overflow bugs, etc…) the more likely we are to overprimise and underdeliver.
We’ve been playing with leveraging something like Playwright to show content in emulated devices using other rendering engines, but the overhead is quite high as of now.
Your help needed
I’ve published an explainer on GitHub that covers possible scenarios and will get more design ideas soon and we have an Issue on GitHub tracking the progress. I would love to hear more what you think would be a better experience than what we have right now.