Christian Heilmann

You are currently browsing the Christian Heilmann blog archives for October, 2021.

Archive for October, 2021

Edge DevTools for Visual Studio Code 1.4.0 – Improved Screencasting, Device Emulation and live, inline issue reporting

Thursday, October 28th, 2021

The 1.4.0 release of the Microsoft Tools for Visual Studio Code brings a few highly requested features. We improved the screencasting feature, added device emulation and live issue reporting in your source code. You can check the 3 minute highlight reel here .

Improved screencasting

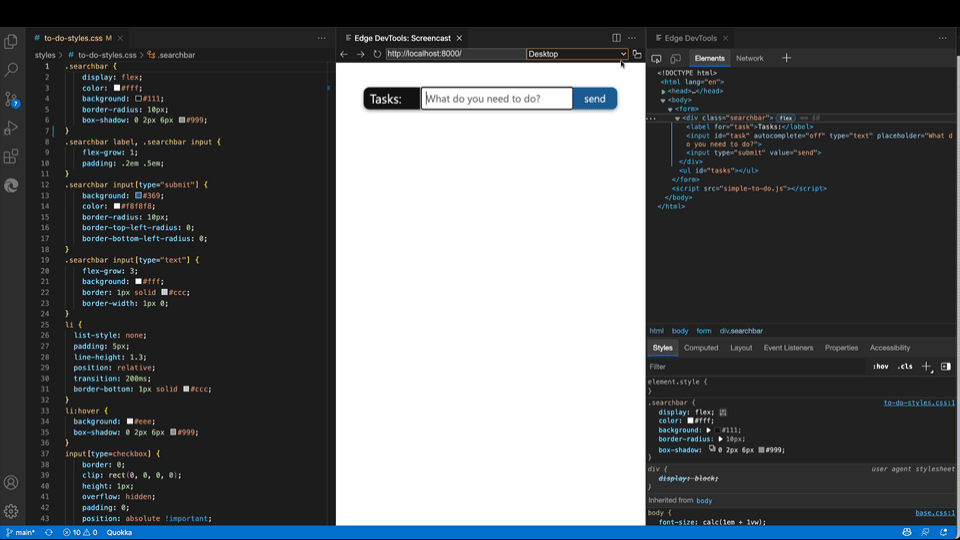
In previous versions of the extension, the screencast was a rudimentary feature tied to the panel of the extension. This didn’t give you much space to play with and the interactivity was limited. In this version, we moved the screencast to an own tab, which means that you can move it anywhere you want in your Visual Studio Code and use split panels. Furthermore, the screencast now supports developer tools overlays, which means you can see the padding and margin when navigating the HTML source and the inspector overlays.

A demo of the new screencast features, like moving between tabs and showing the inspector overlays

Device emulation

One of the most requested features of the screencast was device emulation. People wanted to simulate different mobile devices without having to switch to the browser. Right next to the location field of the screencast you can now find a dropdown with a pre-populated list of mobile devices. You can select any of them and the viewport of the screencast will get resized accordingly. If the device is a touch device, you also get touch emulation, as indicated by the cursor changing to a filled circle. Next to the dropdown you also get a button to switch the device orientation.

A demo of the new screencast feature device emulation, showing how to pick a device and seeing the resized viewport and touch emulation

Live inline issue reporting

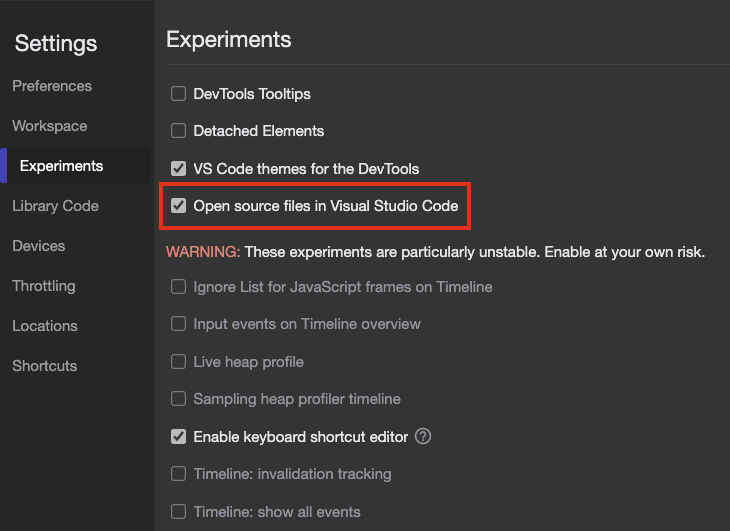
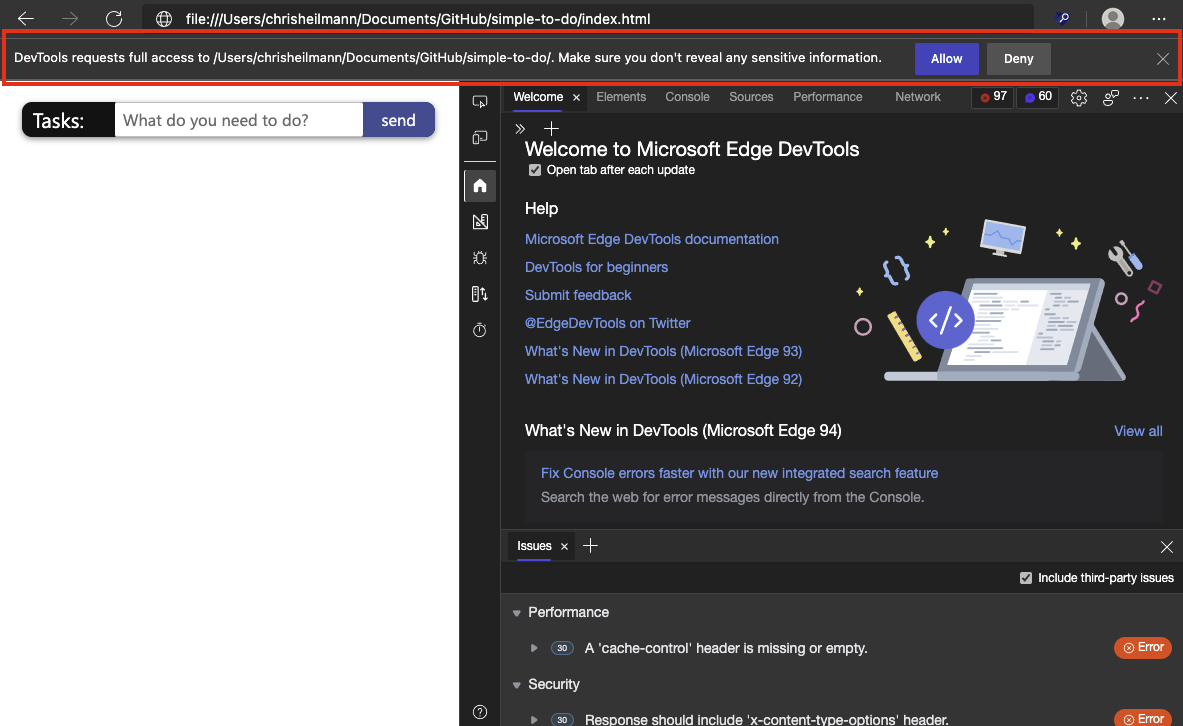
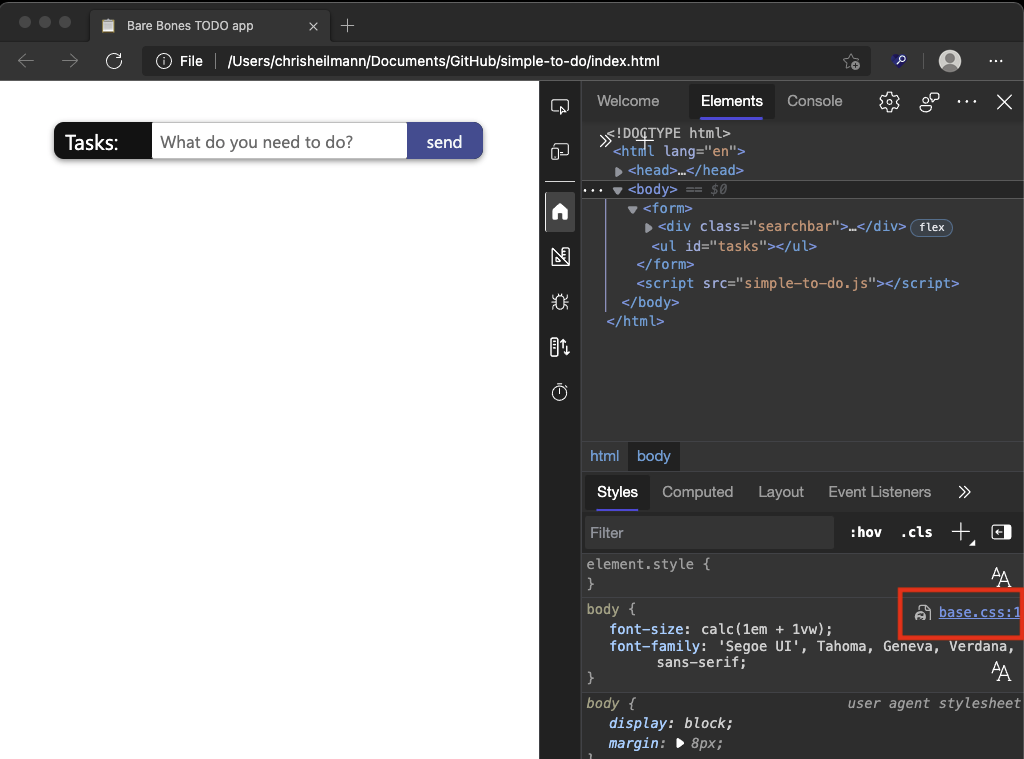
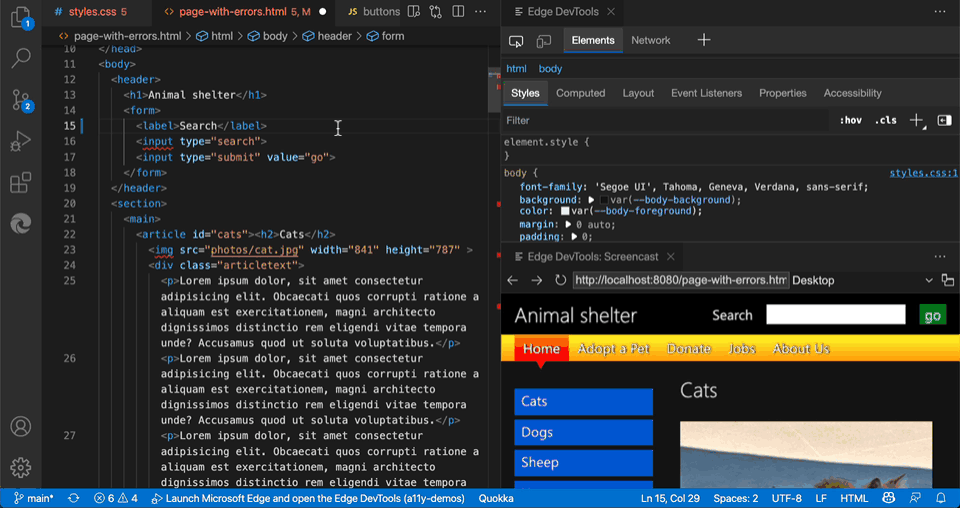
The issues panel in browser developer tools shows you problems with accessibility, interoperability, performance and security. We considered moving this one to the extension, but thought we can do better. If your source code now has an issue, you will see a red underline under the line of code. You can hover over the line and you get information what the problem is, how to fix it and links to more documentation. You can also navigate all the issues in the current document or use the problems tab in the lower panel to see all issues in the current workspace.

A demo of showing issues live inside source code, how to navigate the issues, using the problems panel and live code validation

Get the extension

The extension is available for all major platforms from inside Visual Studio Code and on the marketplace. The source is also available on GitHub and we invite anyone to file issues you encounter. Some of the functionality is dependent on you having an installation of Microsoft Edge Canary and you need to have Node/NPM installed on your machine.

What if… you could use Visual Studio Code as the editor of in-browser Developer Tools?

Tuesday, October 12th, 2021

Starting with the next version of Microsoft Edge, we are running an experiment that allows you to use Visual Studio Code as the editor of the in-browser Developer Tools. Here’s a three minute video explaining why we think this is a good idea.

Developer Tools have excellent visual tools that allow you to tweak and debug front-end code. The problem is that the changes aren’t synced and once you reload the page, all is lost. Workspaces are a feature to work around that issue and I blogged about those some time ago. We wanted to use the sync capabilities of Workspaces and replace the in-built editor in the Sources tool with Visual Studio Code, effectively giving you the convenience of the editor you are used to and the visual tooling the browser DevTools provide.

To this end, we came up with a new way to invoke a Workspace and make VS Code the editor of the browser. It is an experiment you need to turn on in DevTools by choosing the gear icon.

Turning on the experiment

Once you enabled the “Open source files in Visual Studio Code” experiment, the browser will automatically detect when you work on a local file or local server.

Working on a local file in Edge

It then prompts you to define the root folder of this file and tell DevTools where to find it.

DevTools asking you to identify the root folder

You can get more information, or skip setting up the functionality. Once you pressed the “Set Root Folder”, you can pick the folder using Finder or Explorer (or whatever other file manager you use).

Picking the root folder

Once chosen, DevTools needs access to this folder to write files to it.

DevTools with toolbar asking for access to the folder

If you grant DevTools access, activating any link in the tools will now open the folder with all the files in Visual Studio Code instead of the in-built editor in the Sources tool.

A link to a CSS file

You get a new instance of VS Code and the file opens on the correct line.

CSS file openet in VS code

Any of the changes you do now to the CSS in DevTools changes the file and is reflected inside VS Code. If you do a change in VS Code and save the file it also syncs live in the browser.

You can change the settings of the experiment to not open files in VS Code and to not live sync the changes.

Experiment Settings

You can read more about this on the official docs and we’d love to hear what you think of it. You can comment on Twitter at @EdgeDevTools or use the feedback mechanism built into the tools directly.