Monky Business: Creating a Cistercian Numerals Generator
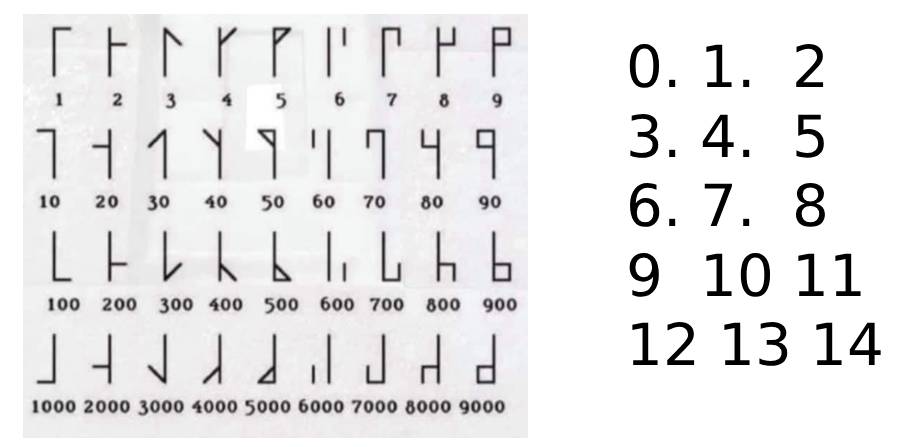
Tuesday, January 13th, 2026 at 4:20 pmIn the 13th century Cistercian monks came up with a way to show the numbers from 1 to 9999 as a single character.
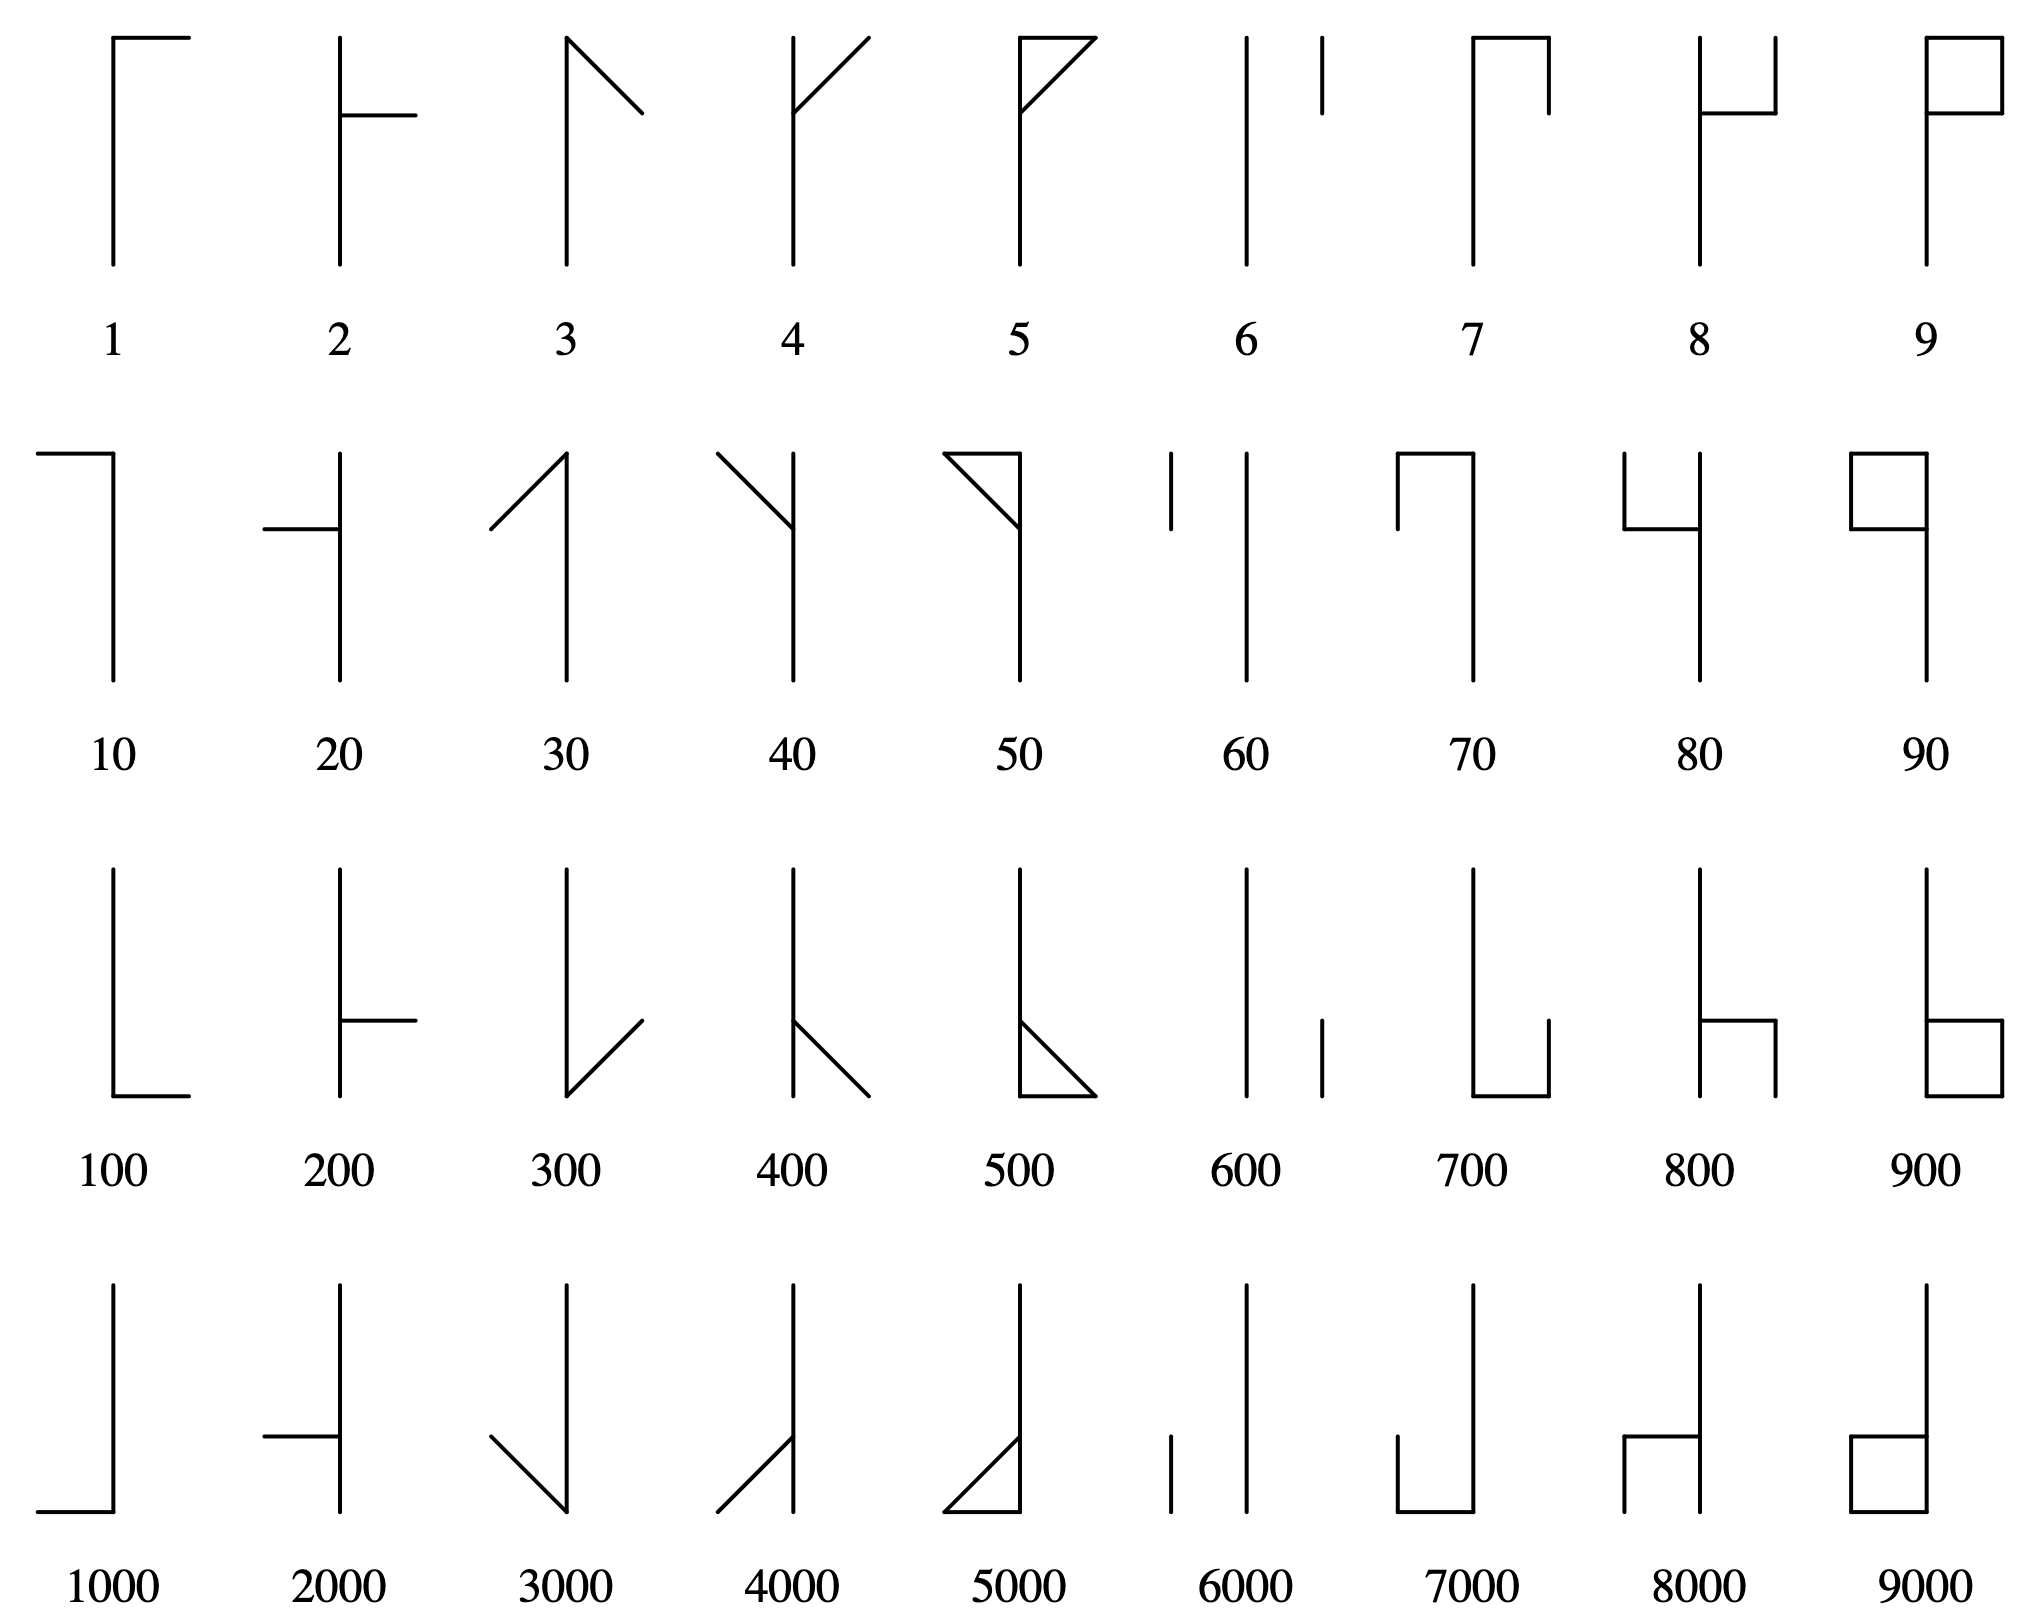
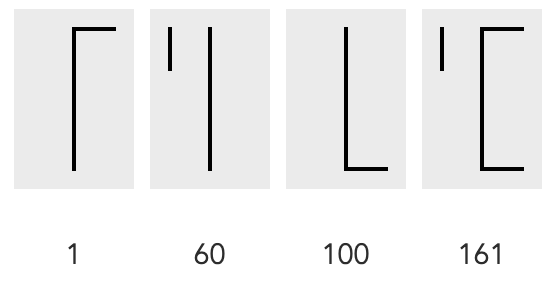
The way it works is to add the lines of different characters to each other until the number is reached. So, if you want to show 161, you take the 1, the 60 and the 100 and add them together:
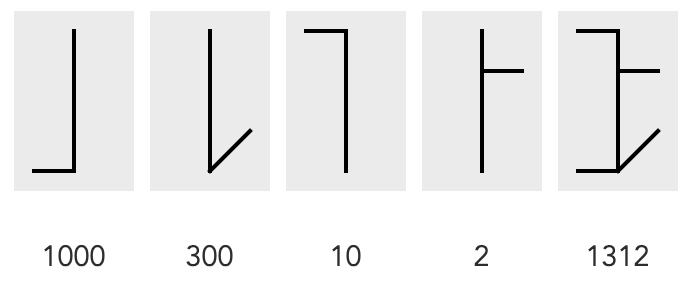
Same with 1312 as 1000 + 300 + 10 + 2:
Which is pretty much incredible, so I thought it would be fun to create a generator for those characters. And here it is:
And while we’re at it, why not have a Cistercian Clock ?
How to use the generator
Open it in your browser and enter the numbers you want to generate. You can also get the source code, download it and use it offline. You can generate numerals as PNG or as SVG, click them to download the images and click the X buttons to remove them.
How to use the code in your own products
The generator is based on a script I wrote to generate the numerals, all available on the GitHub Repo. There are two flavours, a simple Node based one that returns SVG strings and a more advanced one that allows for in-browser PNG and SVG generation and customisation.
toCistercian.js – Node or browser number to Cistercian numeral converted in SVG
You can use this on the command line using:
node toCistercian.js {number} |
For example `node toCistercian.js 161` results in the following SVG:
<svg width="120" height="180" xmlns="http://www.w3.org/2000/svg"> <title>Cistercian numeral for 161</title> <line x1="60" y1="20" x2="60" y2="160" stroke="#000" stroke-linecap="square" stroke-width="4"/> <line x1="60" y1="20" x2="100" y2="20" stroke="#000" stroke-linecap="square" stroke-width="4"/> <line x1="60" y1="20" x2="60" y2="160" stroke="#000" stroke-linecap="square" stroke-width="4"/> <line x1="20" y1="20" x2="20" y2="60" stroke="#000" stroke-linecap="square" stroke-width="4"/> <line x1="60" y1="20" x2="60" y2="160" stroke="#000" stroke-linecap="square" stroke-width="4"/> <line x1="100" y1="160" x2="60" y2="160" stroke="#000" stroke-linecap="square" stroke-width="4"/> </svg> |
You can also use this in a browser as shown in the simple example:
<output></output> <script src="toCistercian.js"> </script> <script> const svg = toCistercian(1312); document.querySelector('output').innerHTML = svg; </script> |
Cistercian.js – convert to svg/png/canvas with customisation
The generator uses the more detailed cistercian.js version, which allows you to generate numerals in various versions and formats.
Usage is in JavaScript and a browser environment.
const converter = new Cistercian(); converter.rendernumber(1312); |
This would add an `output` element to the body and render the numeral with a text representation and a button to remove it again.
You can configure it to change the look and feel and what gets rendered by calling the `configure` method. See the advanced example for that.
If you want, for example, to render the numeral inside the element with the ID `mycanvas` as SVG with a `width` of `400`, lines 10 pixels thick and in the colour `peachpuff` and without any text display or button to delete, you can do the following:
<div id="mycanvas"></div> |
myConverter.configure({ renderer: 'svg', canvas: { width: 400 }, stroke: { colour: 'peachpuff', width: 10 }, addtext: false, addinteraction: false, outputcontainer: document.getElementById('mycanvas') }); myConverter.rendernumber(1312); |
How I built the thing
As with many things I code for fun, this started offline, with me thinking how to approach this issue. In essence, all I had was an image of the numerals. When I got home, I thought I should give this to Copilot to vibe code like all the cool kids do. I asked it to take this image of numerals and create SVG versions for each of them (so I could link to them). The result was fast, immediate, confident and utter garbage.

So I went back to analysing the numerals and instead of creating them as SVGs, I created them as a dataset. In essence, these are characters on a 3 by 5 grid. I numbered the points and wrote them down as coordinates:
this.points = [ [10,10],[30,10],[50,10], [10,30],[30,30],[50,30], [10,50],[30,50],[50,50], [10,60],[30,60],[50,60], [10,80],[30,80],[50,80] ]; |
The middle line is never used in the real numerals, but hey, why not?
Then I looked at the numerals and noted down which points are connected for each of them. 1 and 13 are always there as this is a vertical line in the middle. This gave me the dataset to use with Canvas or generate SVG from. Here are the indices of the points array that describe all the glyphs:
this.glyphs = { 0: [[1,13]], 1: [[1,2]], 10: [[0,1]], 100: [[14,13]], 1000: [[12,13]], 2: [[4,5]], 20: [[3,4]], 200: [[10,11]], 2000: [[9,10]], 3: [[1,5]], 30: [[1,3]], 300: [[13,11]], 3000: [[13,9]], 4: [[4,2]], 40: [[4,0]], 400: [[10,14]], 4000: [[10,12]], 5: [[1,2],[2,4]], 50: [[0,1],[0,4]], 500: [[13,14],[14,10]], 5000: [[13,12],[12,10]], 6: [[2,5]], 60: [[0,3]], 600: [[14,11]], 6000: [[12,9]], 7: [[1,2],[2,5]], 70: [[0,1],[0,3]], 700: [[13,14],[14,11]], 7000: [[13,12],[12,9]], 8: [[4,5],[5,2]], 80: [[4,3],[3,0]], 800: [[10,11],[11,14]], 8000: [[12,9],[9,10]], 9: [[1,2],[2,5],[5,4]], 90: [[0,1],[0,3],[3,4]], 900: [[13,14],[14,11],[11,10]], 9000: [[13,12],[12,9],[9,10]] }; |
The rest was just comparing and looping over this array.
The logic of adding to the final numeral was not too taxing either. When the number wasn’t defined in the glyphs array, I turn it into a string and loop over it from the end to the start. Each number then gets the added zeroes to allow for the lookup:
let chunks = number.toString().split('').reverse(); chunks.forEach((chunk, index) => { let value = chunk + '0'.repeat(index); |
So, for 1312, this would become 1312 and on each loop iteration I get the data:
- 2
- 10
- 300
- 1000
Feel free to check the source of the script for some more fun bits. And yes, I did use Copilot to help with some of the cruft code I didn’t feel like writing by hand, especially turning functions into methods and such.
I had fun, I hope you find it interesting, too.