Celebrating 1M installs of Edge DevTools for VS Code
Thursday, September 15th, 2022 at 6:57 amThe Edge DevTools for Visual Studio Code extension has over 1M downloads, time to recap a bit how it came to be
When I started my current role in Microsoft one thing that ailed me was that the browser developer tools are great for debugging, but they aren’t changing the original code. It is quickly possible to find out why something doesn’t work and it is convenient to use visual tools to fix the problem but you still need to remember what you changed and repeat those changes in your editor.
One of the engineers on our team showed me an idea he had. As both the browser and the editor (in this case Visual Studio Code) are based on the same platform (Chromium), it would be possible to integrate the convenient debugging experience of the browser developer tools right into the editor and not only change what is shown in the browser but also the source code that generates it.
I immediately latched onto this idea as a great one and after writing quite a few presentations and many an internal meeting we got funding for the product.
Fast forward to now and the DevTools for Visual Studio Code extension just broke the 1M installs mark.

We also have around 30,000 daily users and get a lot of great feedback on the GitHub repository.
I want to thank everyone involved in this project from the beginning to now. I am always humbled by how much talent the developer team has and how fast you can iterate on a product when you play fully in the open. I also want to thank the Visual Studio Code and the Visual Studio teams to be great partners to integrate with. It’s been a wild ride and it is great to see people be super excited about your work .
If you haven’t tried the extension yet, here is what it does for you:
- Highlights issues in your code with explanations what the issue is and how to fix it. This is live – so while you develop your product you get information about what you are doing and what damage it causes.

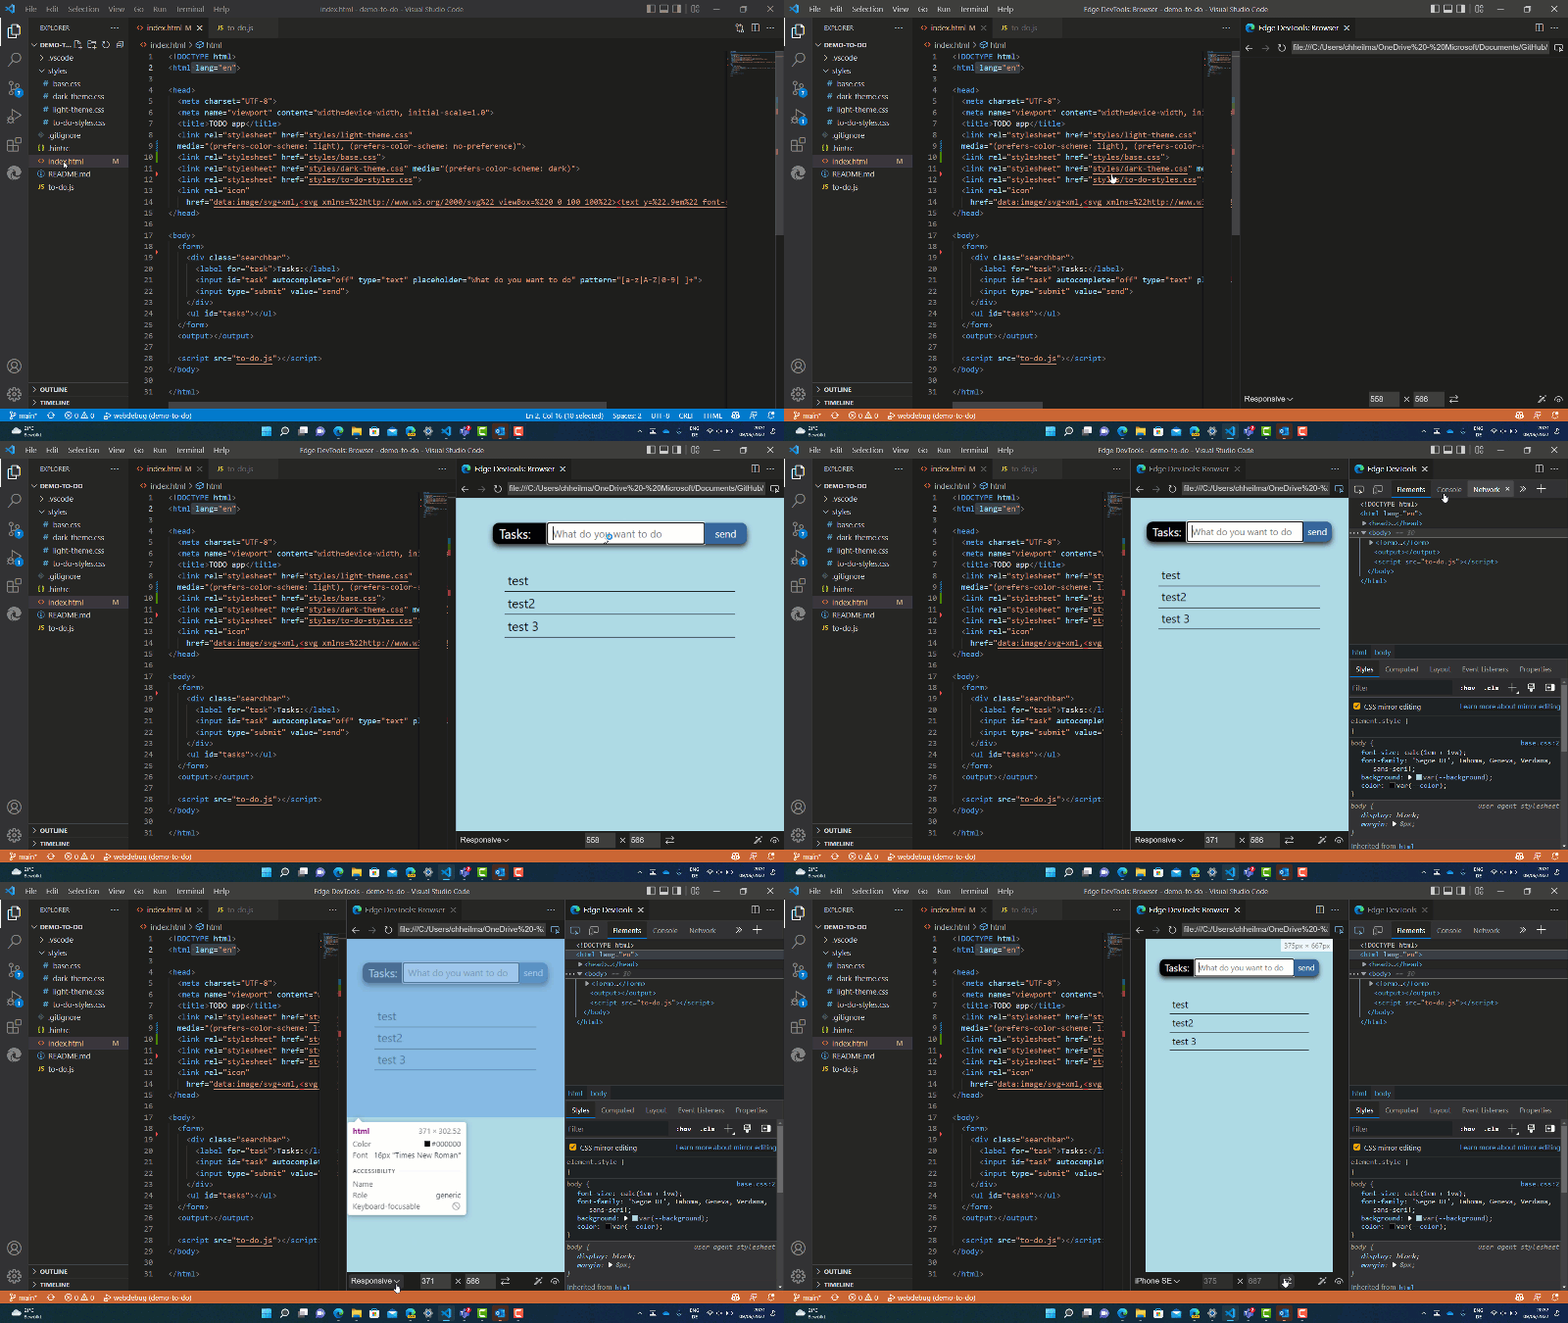
- Shows your product in a browser preview with emulation options (emulate different devices, modes like dark/light/high contrast) and test some of its accessibiltity.

- Syncs changes in the developer tools – like fixing CSS issues live with your source code

- Adds a Console for testing JavaScript

- Adds the Application tool to inspect storage and services running in the background
- Allows you to inspect the network traffic of your product
- Allows to set breakpoints in your source code and get the in-context debugger
Whilst all of this gets the web developer in me super excited, the PM in me is also very happy about what it means to the Chromium developer tools project (which are in use in all the browsers based on it, Chrome, Microsot Edge, Brave…) all up:
- We cleaned up a >10 year old code base to be not a monolithic box in the browser but allowed to use the different tools in the Developer Tools App separately.
- We upgraded the browser screencast of Chromium to a fully fledged panel inside VS code, that can be moved to anywhere you want and has all the interaction you have in a main browser window when it comes to overlays and showing CSS features.
- We integrated the functionality of the issues panel into your code to show you live issue reporting including customisability
Many of the learnings we got from releasing this extension can roll back into the developer tools themselves, with the biggest one being a new emulation/responsive web design toolbar in the main browser window .
There is a lot more to be gained from taking the Chromium Developer tools and embedding them in a different context, and I am excited that we managed to do this and reach this landmark. More to come.
