You haven’t been hacked, these aren’t devices spying on you and these errors aren’t your fault
Thursday, August 18th, 2022 at 9:46 amIt is possible to accidentally open the developer tools in browsers. Either by pressing F12, selecting the “Inspect” option of the context menu or hitting one of the many keyboard shortcuts that open different tools.
These tools can look intimidating and as if someone is hacking your computer. Especially when you see the Console tool displaying a lot of error messages, information about tracking and security violations.
To people conditioned by Hollywood that being hacked means seeing lots of random text and windows popping up on your computer, this can look really bad.
As a product manager working on browser developer tools, I get hundreds of messages each day from the in-browser feedback system. Many of these fall into a few categories:
- Help – I’ve been hacked
- People are spying on me using the Network
- There are devices that connect to my computer
- It shows that there are a lot of errors – what did I do wrong?
These are all based on a misunderstanding of what developer tools in the browser are and who should be concerned about them.
Let’s be very clear here: these tools are for developers to find out what is happening to their products while they develop them and to find out problems that need fixing. They aren’t giving any important or actionable information to you as a consumer of the web.
These tools do not mean that:
- You’ve been hacked – these tools don’t have any access to your account information
- You’ve done something wrong that you need to work on – all these errors and warnings are coming from the web site you’re looking at or extensions you installed. They are meant only for developers to track down why something isn’t working.
- Something external and sinister is connecting to your computer – these tools only show what is happening on your computer and you can’t use them to change anything on the web – everything people do in these developer tools happens locally on their computer.
Nothing happened to your computer or your account information by opening browser developer tools. You can close them and not worry about them as they aren’t meant for people surfing the web, but for developers who build products for it.
If you want some more explanations of the different things that caused the confusion, here are some quick notes.
The Elements Tool
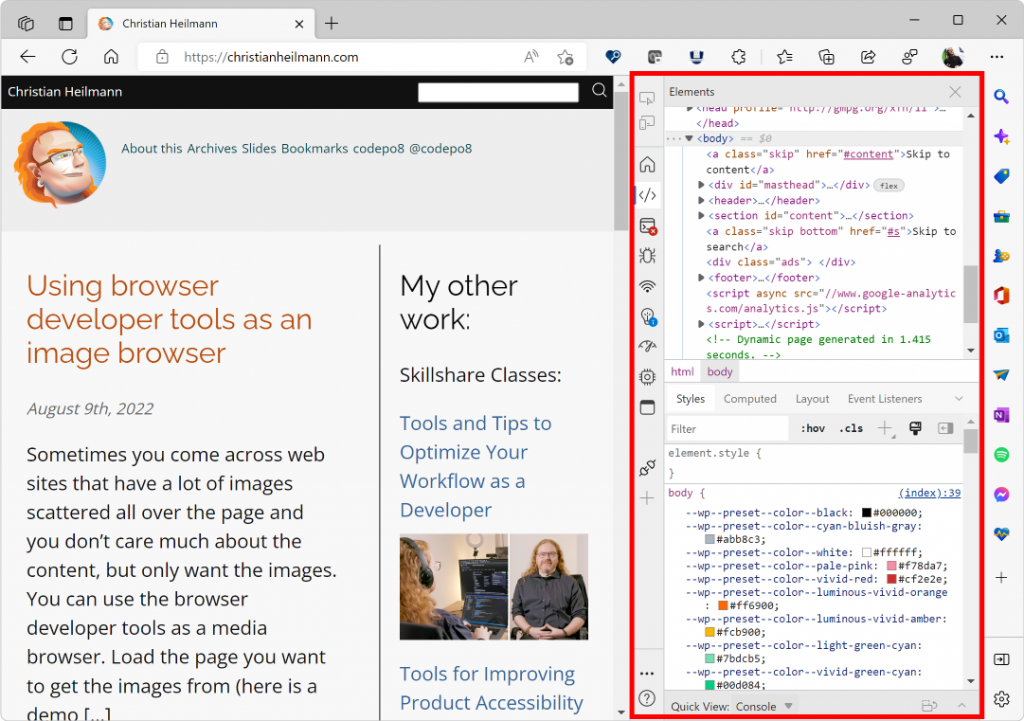
Web sites and apps you use on the web are built using a few standard technologies. One of those is HTML which describes what something is, like a heading, a paragraph or a button. Another is CSS which defines how something looks, like a color of red and a background of blue. The Elements tool allows developers to see what HTML is responsible for what element on the screen and shows the CSS applied to it to make it look the way it does. This helps developers to tweak the look and feel of a product in a visual manner. You can play with the Elements tool to peek under the hood of the web and see some of the machinery, but none of this is yours to fix or worry about.
The Console Tool
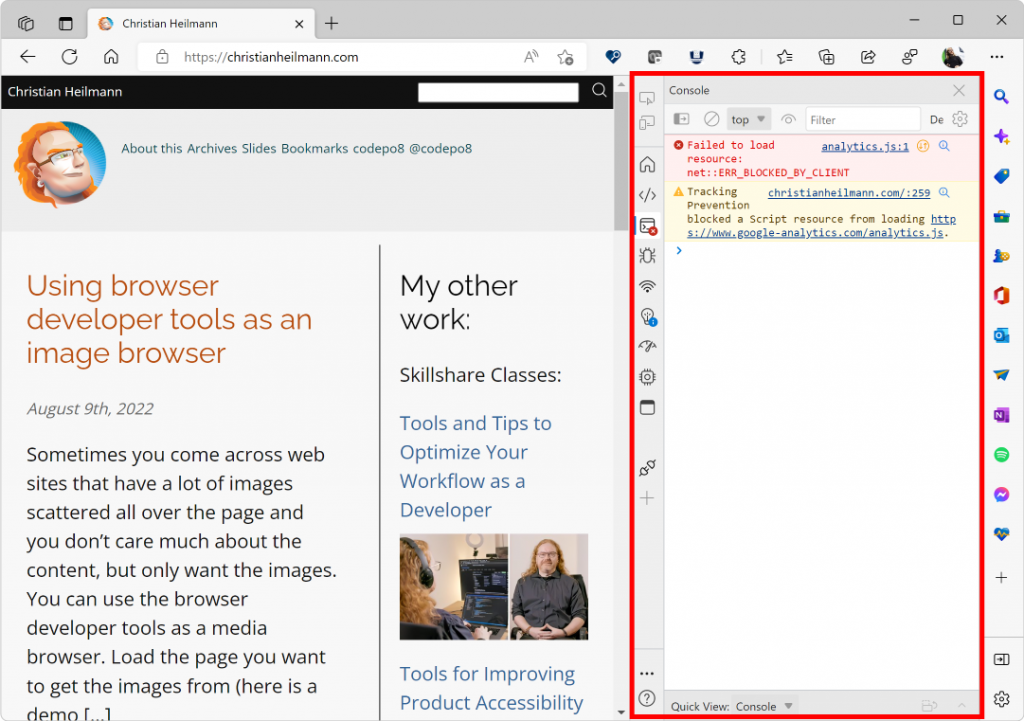
The Console tool is like a scratchpad for developers. When you want to analyse what is going on in your program, you can use a command called `console.log()` to write something on it. This is how developers find out why something isn’t working. As developers use this, the browser also displays information on it when something happened – like your security and privacy settings preventing something from getting loaded. As a developer, this tool is incredibly useful. Technically we should not keep any messages displayed on it once the problem has been fixed, but as with any scratchpad, you often forget about it. That’s why the Console is so full of messages. As you aren’t the developer responsible for the current web site you’re looking at, you can safely discard these as not your problem.
The Network Tool
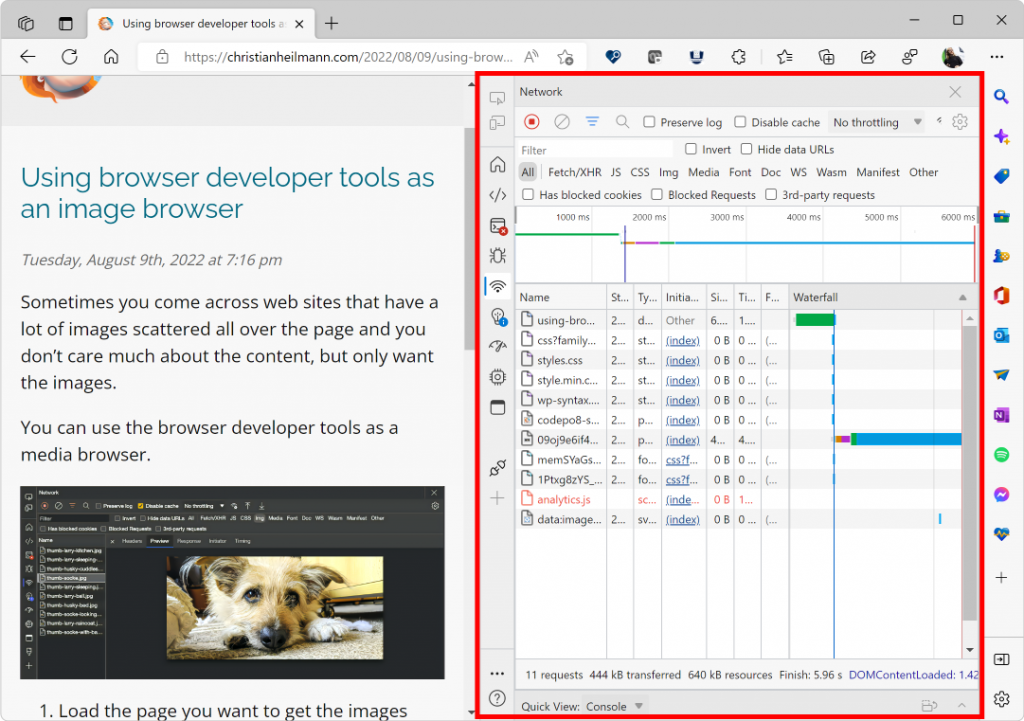
The Network tool shows the traffic on the network that happens when the current page is loaded and when you interact with it. This is not the traffic of your computer and all the things that come from the web or go from your computer out to the web. It only shows what the current web site does and allows developers to find out why some functionality is broken because something could not be loaded. It also allows developers to find out why the product may be slow to load or respond. You can use the Network tool to download images or videos if you want to, but on the whole, this tool doesn’t show anything that happens to your computer or has any information why your internet connection may be flaky or slow.
Device Emulation
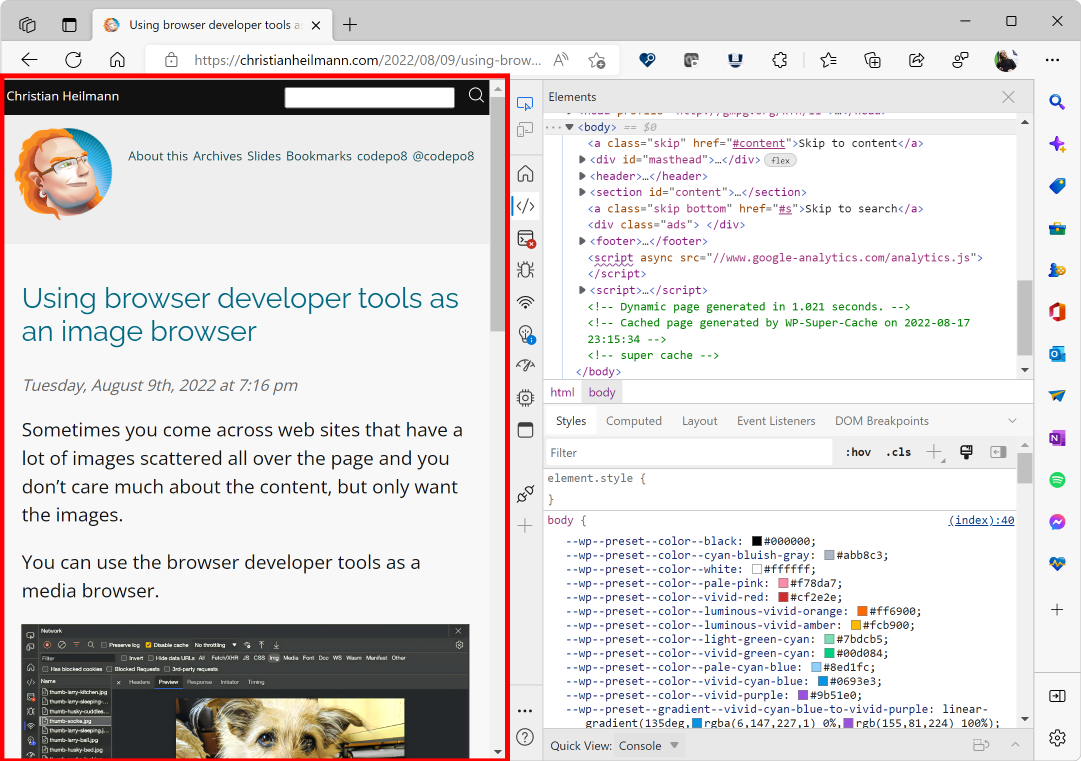
The great thing about the web is that it works on many different devices. The problem for developers is that testing your web product on many different devices costs a lot of time and possibly money as you need to buy, maintain and know how to use these. That’s why Developer Tools have a device emulation tool that allows you to see the web site you are working on in the dimensions of a different device. For example, this is this web site as a laptop would show it:
And this is how it looks on a mobile device, in this case an iPhone XR:
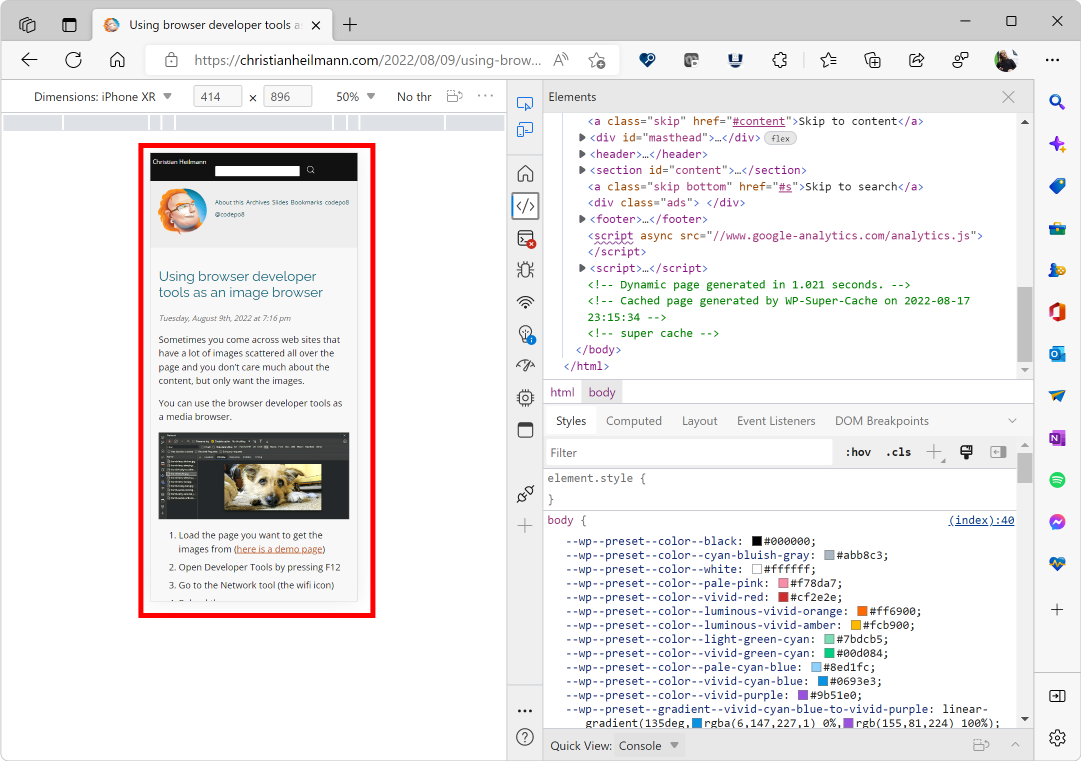
All the device emulation mode does is show the current web project with the right screen size of different devices. When you use the emulation mode and load a web project, your computer also tells that web site that it is that device, which is why you get the different look and feel. None of these devices exist, and none of them connect to your computer. This is different from “find my device” services on the web. All the device emulation does is give developers a quick and easy way to see what their products look like in different environments. Everything happens on the current computer and no external service or device is connected to your computer.
Don’t fear the tools – they help us build great web products for you
You can also refer to the official documentation and read up on things in more detail. We’re trying to make the documentation easy to understand and would love to know what we can do better. If you got interested in developer tools, you may also check out what they can do for you as a non-developer.