Edge DevTools for Visual Studio Code V2 – new browser preview with emulation and sourcemap support
Thursday, May 5th, 2022 at 1:51 pmThe V2 version of the Microsoft Edge DevTools for Visual Studio Code extension is now live. We’ve worked hard to make the current feature set more stable and introduced new ones.

Console integration
Console Integration – makes it easier to use `console.log()` or interact with the document right from the developer tools. We found the old integration to be flaky and hard to find in the `Output` panel.

Improved CSS Mirror editing
CSS Mirror Editing – making sure that none of your tweaks in DevTools get lost. This is now out of experiment and doesn’t use up as much screen estate any longer. You can enable and disable it in the Styles tool.

Updated issue reporting
Live issue reporting of problems in your code. If you have any code that is a problem you will see a wavy underline on it. You can hover over it with your mouse or use the `Problems` panel to learn what is wrong and how to fix it. We’ve updated the issue engine to make sure you get the latest and will soon offer ways to customise the issues you’d like to see. For now, we’ve removed Internet Explorer error reporting as it may rest in peace.

Brand new browser preview with emulation
🆕 Screencast with emulation features – we added a brand new browser preview that doesn’t only give you the browser to interact with right in the editor but also offers various ways to emulate different environments. On the bottom of the browser preview you get a toolbar with various options:

First is the device list. You can select from a wide range of different emulated devices.

If you don’t select a device but choose `Responsive` instead, the browser will take up the whole available space. You can also define a viewport size using the form and rotate the viewport with the double arrow.
The magic wand menu allows you to simulate various CSS media queries, like print mode, dark/light mode or even simulate a forced colours (high contrast) environment. If you want to know more about forced colours, check this incredible article

The last menu (currently using the eye icon) allows you to simulate different visual impairments, like seeing the page in a blurred fashion or in different “colour blindness” emulations.

🆕 Sourcemap support for styles – means you can now debug the styles of Sass/React and other abstraction apps without leaving Visual Studio Code.
For lots more details you can also check the Changelog
Getting started with sourcemapped styles debugging
I’ve covered this here before when I asked for feedback, but now this should be much easier. If you open the Terminal you can do `npm i` and `npm start` to build your App and run the server. In this example, the app is now available at `http://localhost:3000`.

If you click the Edge icon you get the option to launch an instance of Edge or `Generate launch.json` file. Click the latter.

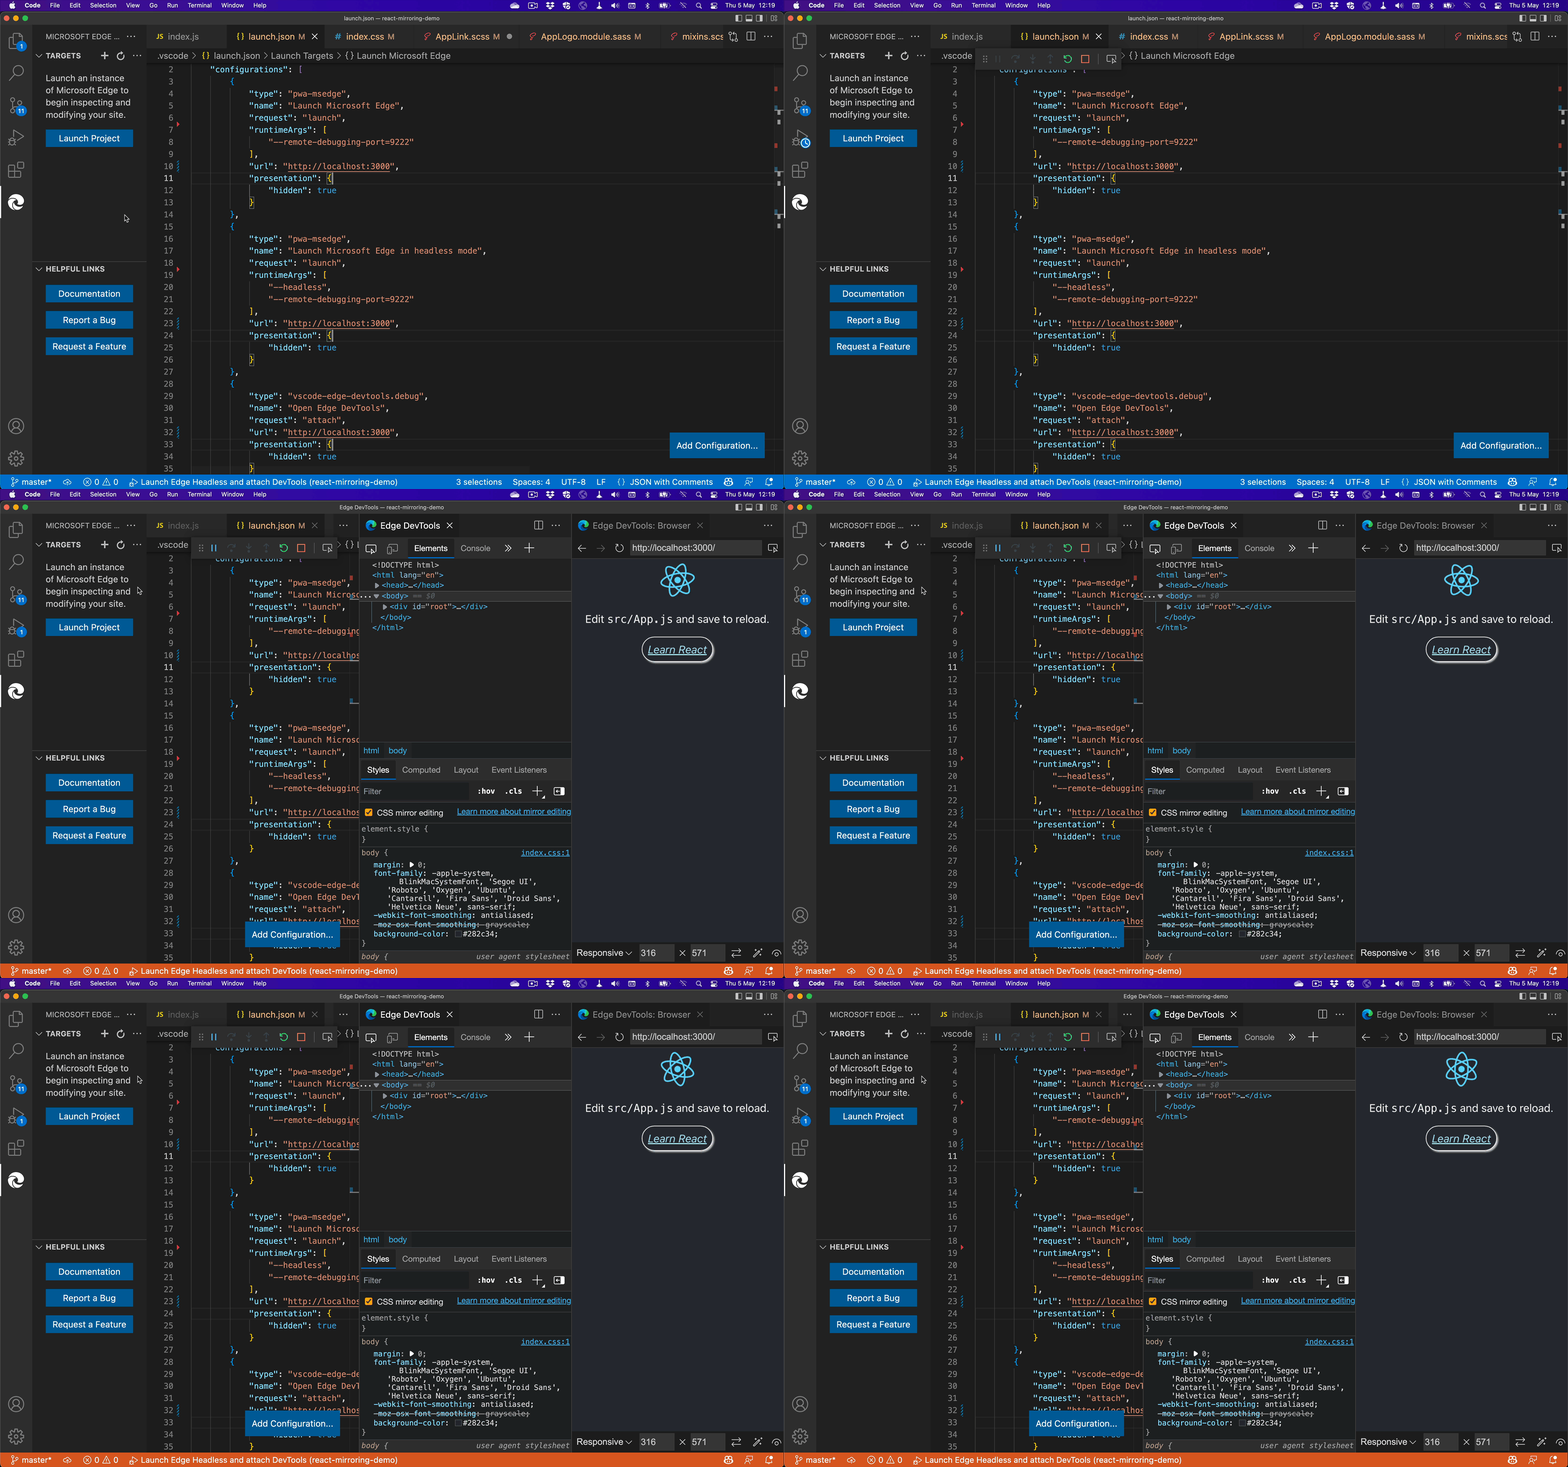
This generates a `launch.json` file in a `.vscode` folder of your app with all the correct settings. Find all the instances of `url` and change them to `http://localhost:3000`:

Save the file and press F5. Visual Studio Code will start the debugger and open a browser window with your app and the developer tools right inside the editor.

If you now edit the styles of any of the elements of your app, you don’t only change CSS files in your project, but also their scss source files or modular styles.

For this to work, you need to set up sourcemaps correctly in your project. As we assume this to be problematic for some people, we have an issue open in the extension repo where you can find help.