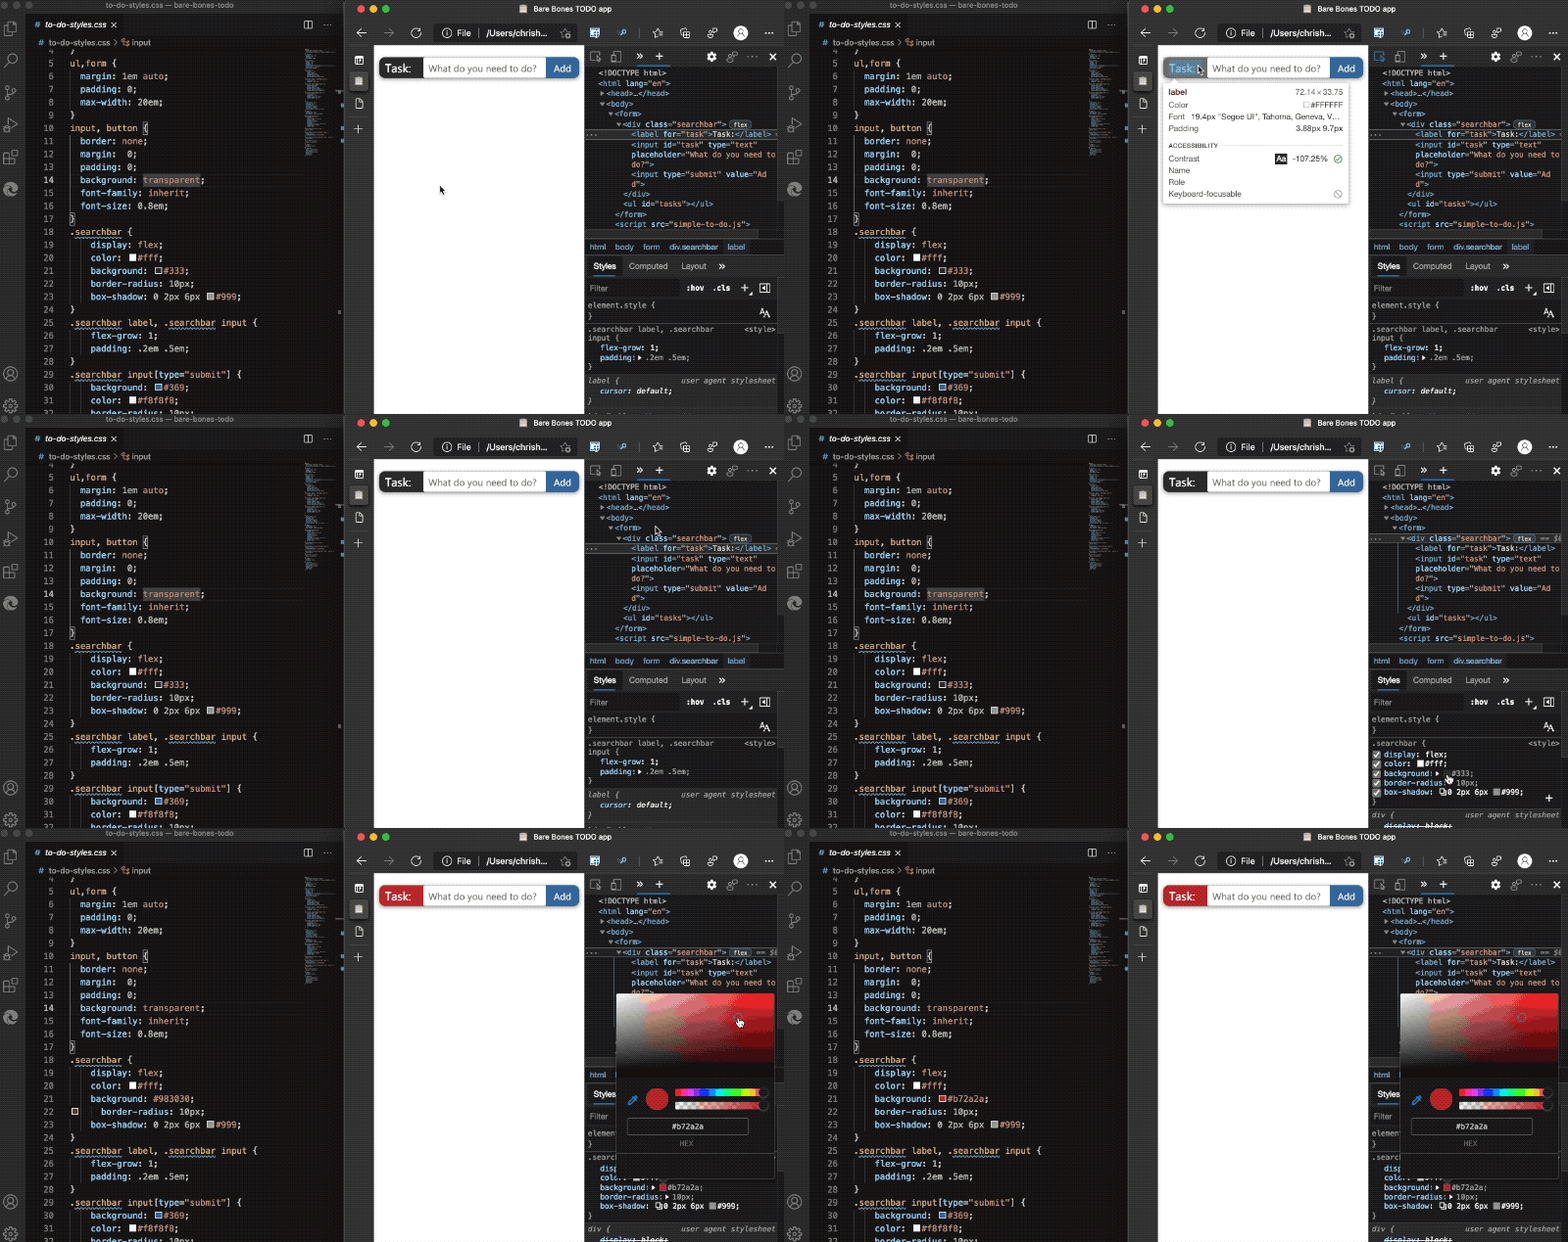
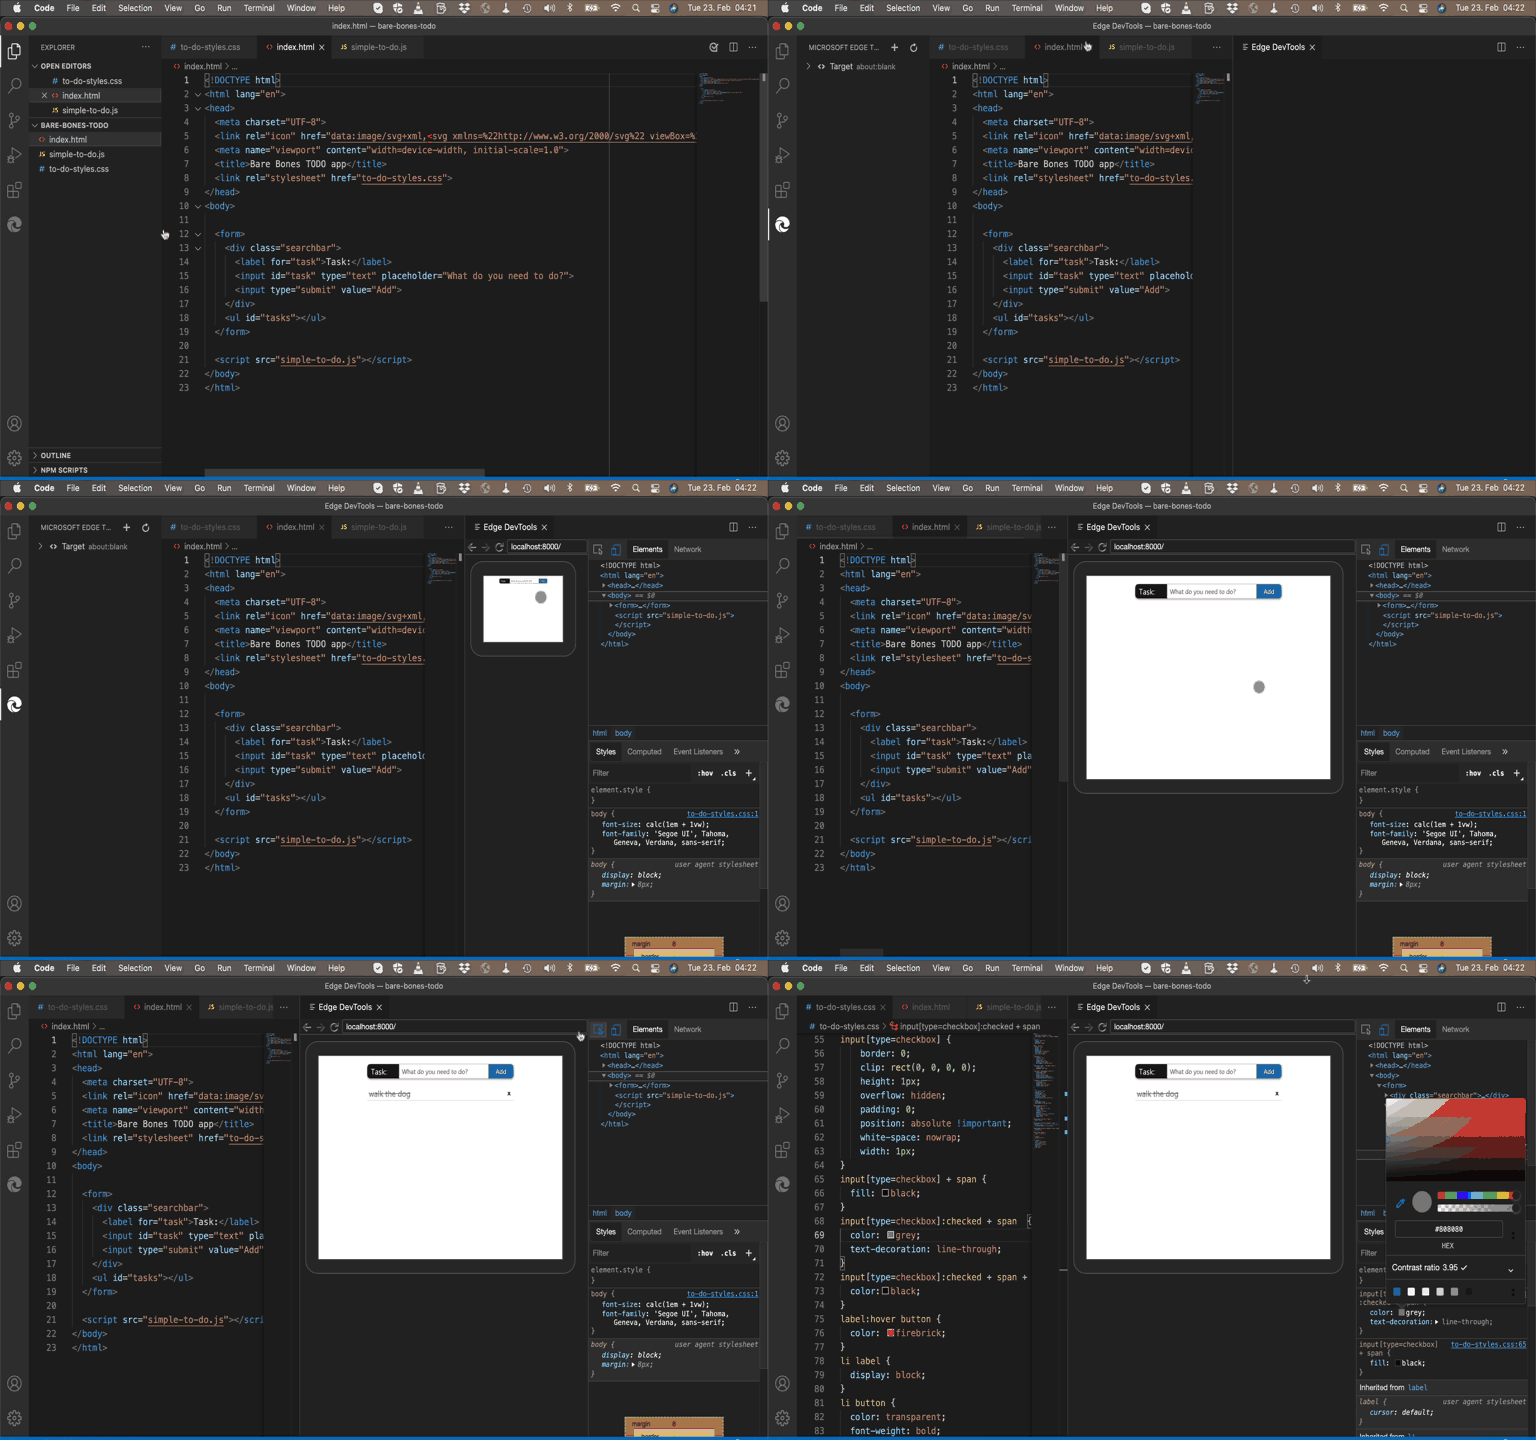
New article: “Beyond console.log() – level up your debugging skills”
Tuesday, March 9th, 2021 at 12:41 pmToday, Sitepoint released an article they commissioned me to write a few weeks ago that a lot of work went into and I’m happy with the result. In Beyond console.log – level up your debugging skills I describe a few features of Chromium browser developer tools and how they interact with Visual Studio Code.
I cover the following topics/features:
- Getting more information in your console.log() statements by wrapping values with curly braces
- Formatting/converting log values with specifiers, for example console.log(‘%ix %s developer’, 10, ‘console’) resulting in “10x console developer”
- Grouping logging statements
- Using console.info(), console.warn() and console.error() to allow for filtering
- Timing things with console.time() and counting with console.count()
- Using live expressions to avoid slowing down your debugging with tons of log messages
- Using Console utilities
and built-in convenience methods like $() or monitor() - Using console.table() to display information, f.e. can you guess what console.table($$(‘img:not([src^=data])’), [‘src’,’alt’]) does?
- Moving from Console to Sources
- Using the Command Menu to access functionality faster
- Storing your DOM manipulation scripts in Sources fo easier re-use
- Enhancing third party websites with Overrides
- Syncing changes you do in Developer tools live with your editor using Workspaces
- Using the browser developer tools in Visual Studio code using the Edge Devtools for VS Code extension
- Moving on to breakpoint debugging

