[Video] How to debug web projects using the browser developer tools inside Visual Studio code
Friday, March 5th, 2021 at 8:08 pmWith the 1.1.4 release of the Microsoft Edge Devtools for Visual Studio Code extension we have added the final bit that people kept asking for: Console messages now show up in the output console of Visual Studio Code.
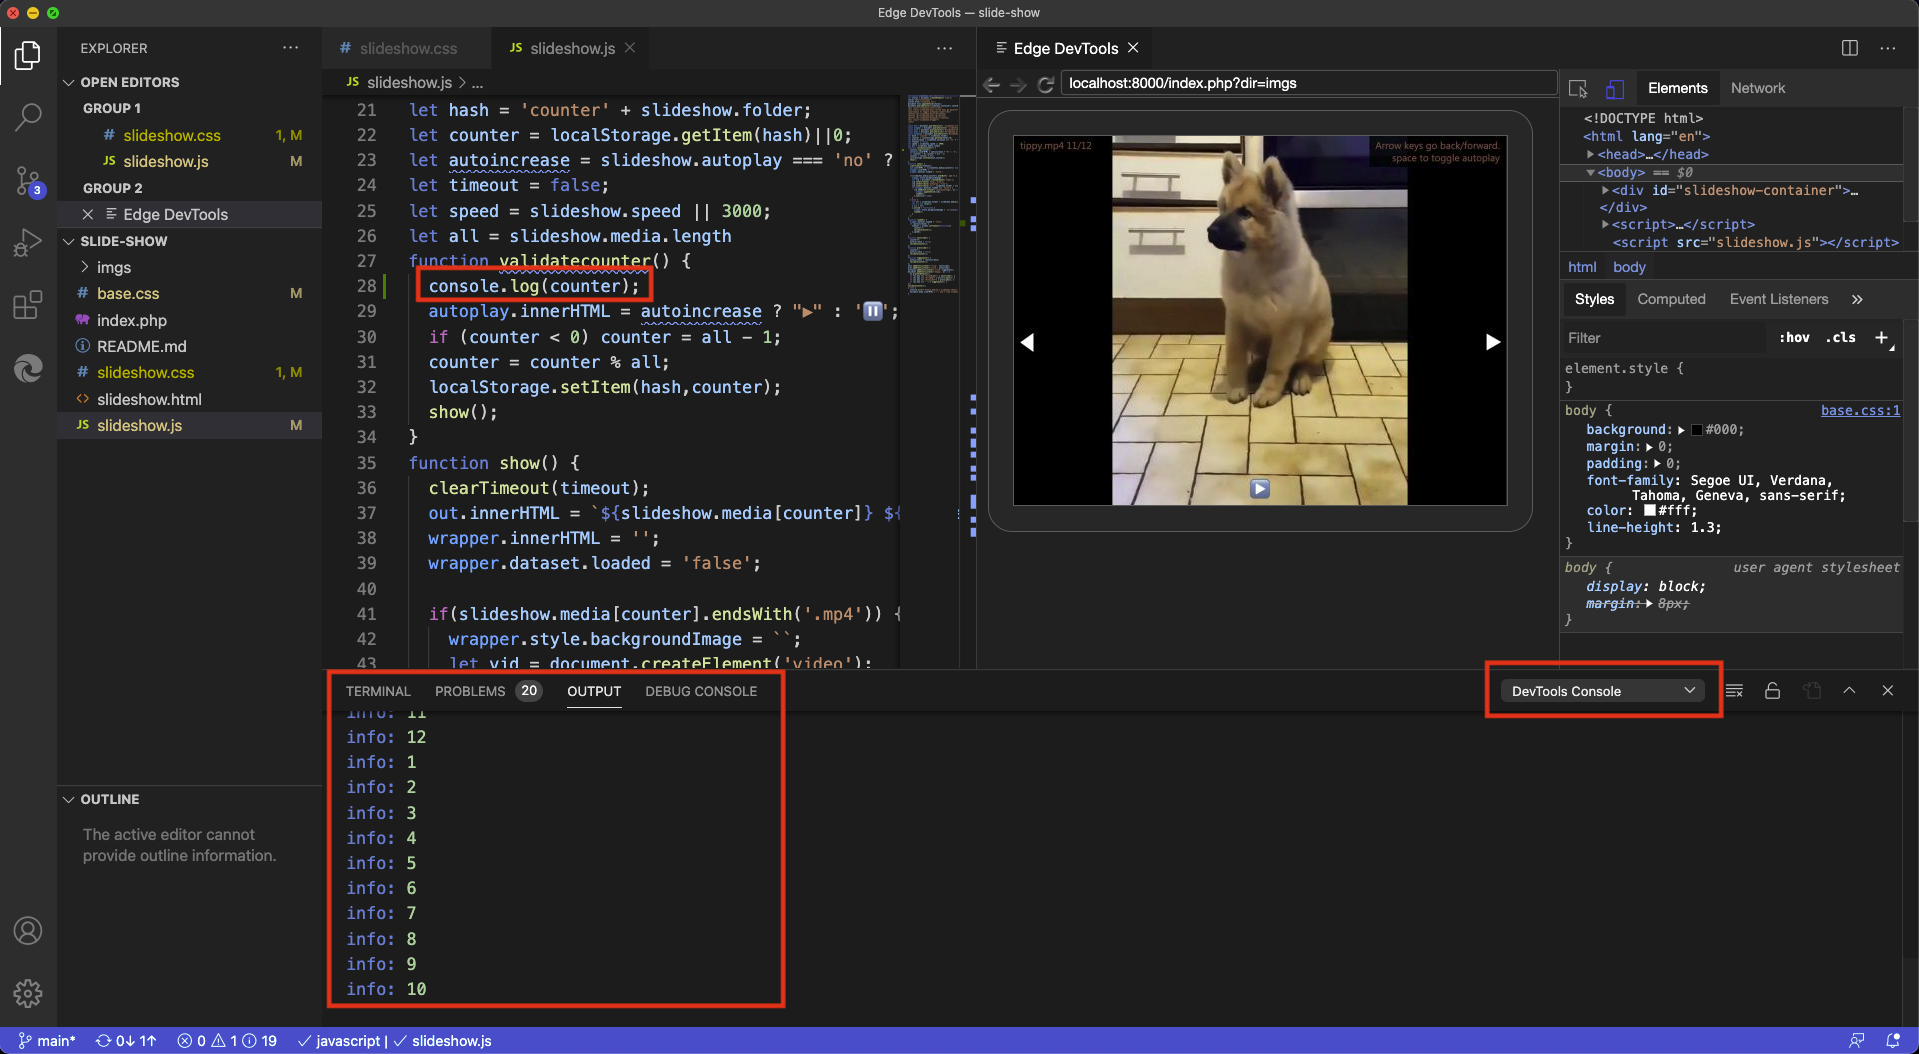
To celebrate and as it has been long coming, I recorded a quick, roughly four minute video walkthrough showing how:
- You can start a server inside Visual Studio Code in the correct folder without using an external terminal
- You start using the extension by creating a new instance of Edge running inside the editor
- How to debug network issues in the editor
- How to tweak the DOM and CSS in the editor
- How the extension allows you to activate the link to a style sheet in the CSS editor to jump to the correct line in the file inside the VS Code editor
The extension is available from the market place and inside of Visual Studio Code. It is open source and you can file issues on GitHub and see what’s coming next.