Bringing Edge’s Developer Tools to VS Code for debugging Web Apps – a talk at VS Code Day
Wednesday, January 27th, 2021 at 6:47 pmToday is Visual Studio Code day and I gave a talk about an extension to Visual Studio Code that helps you with avoiding context switching. If you want to listen to the talk, here is a pre-recording I did as a fallback should my connection not work out.
Here’s what I talked about:
Hello there, let’s talk about making it easier to debug web applications with Visual Studio Code.
Specifically I want to talk about context switching and how to avoid it. What does that mean?

As web developers, we work in three different contexts:
- We write our code in an editor
- We check if everything works and tweak it in the browser, and
- We deal with version control and deployment in the terminal.
In essence, we use different tools for each task. This may not seem like much, but it is a cognitive overhead that impacts our developer efficiency. As web developers we are used to this, but people coming from other
platforms to the web are used to having one IDE that does all of that. This makes the web look harder and the tooling of it not up to par.
With browser developer tools we took a first step to remove one of the context switches making it shorter to go from testing to editing.
As you may know, browser developer tools have an in-built code editor. In addition to tweaking individual CSS settings, you can activate the link to the style sheet. This opens it in an editor. You can set up workspaces and you have a breakpoint debugging environment for scripts right in the browser.
The usage of this feature is, well, let’s call it sub-optimal.

The visual tools to tweak and debug CSS issues, on the other hand, are a roaring success. So much so that we keep improving them to offer accessibility and compatibility insights and offer new features like typography and CSS grids debugging.
In the editor space, Visual Studio Code has taken an excellent step towards aligning coding and deployment.
With an integrated terminal, Git support and linting options you don’t have to switch between editor and terminal any longer. If you haven’t looked into it yet, the webhint extension is an excellent way to make sure you don’t make obvious mistakes that you would need to fix in the browser. This cuts down on yet another context switch.
A lot has changed in the browser space since the days of Netscape and Internet Explorer. Browsers can be fully automated using Webdriver. Browsers are also embeddable into other applications as Webviews.
Probably one of the biggest success factors of Visual Studio Code is that it allows for extensions.
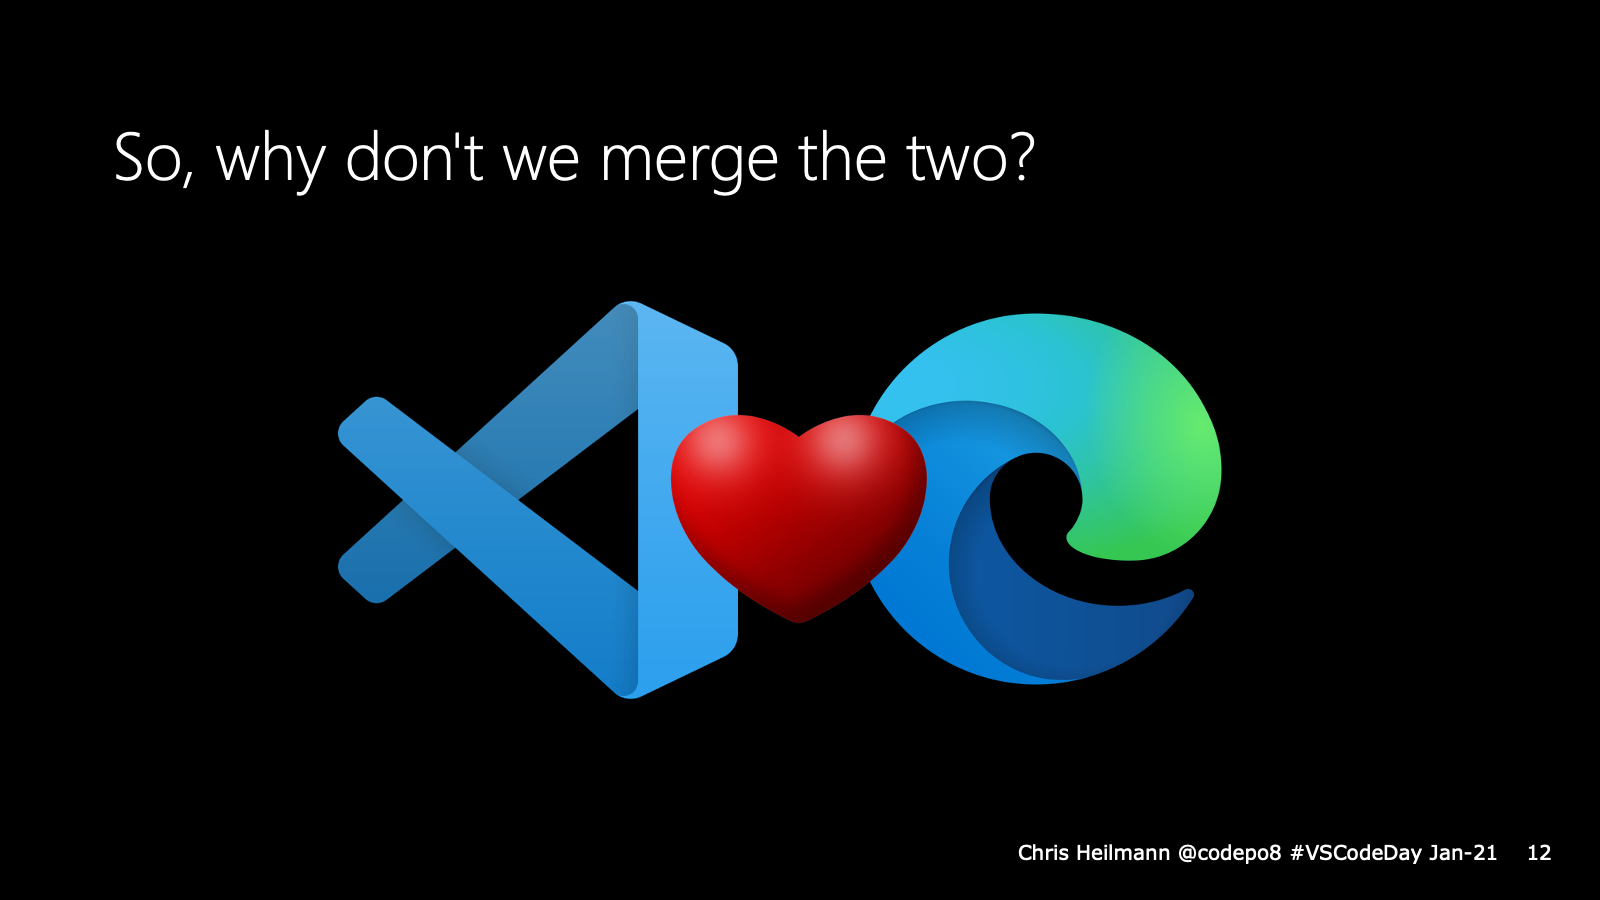
So, why don’t we merge the efforts of Visual Studio code and Edge to cut down on context switching?
This is exactly what we did with the Microsoft Edge tools for VS Code extension. It’s been quite a success so far and we have a lot more plans for it.
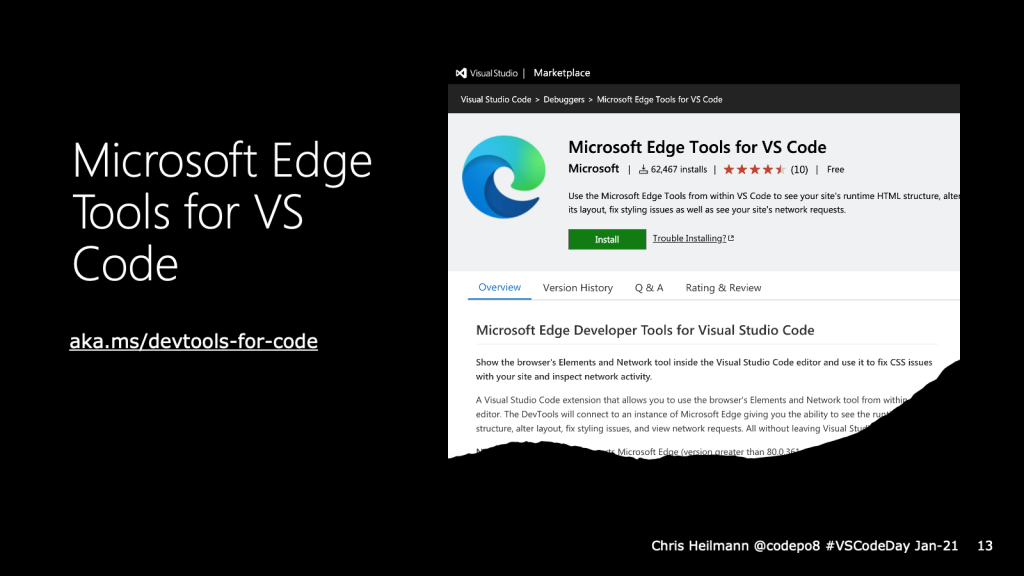
Here is how it works: you open the extension, you connect to a new browser instance and you get a browser right inside Visual Studio Code with the developer tools already open. You can use the Visual tools to tweak the styles and the changes reflect in your source code. Or you can activate the style sheet links in the CSS pane to edit inside Visual Studio Code.
What you can do now…
- Inspect, edit and tweak the DOM structure of the product you build using the tools
- Inspect Network requests
- Interact with the browser inside VS Code
- Sync changes with your code (setting up Sourcemaps/Watchers)
- Choose the version of Edge you want to have in the tool
- Choose an own browser window or a headless version (embedded in the extension)
Things we learned building this extension:
- Making a complex interface like developer tools keyboard and screenreader accessible is hard
- Embedding this interface in an IFRAME in an extension makes that even harder
- There are quite some differences in keyboard handling between Mac and PC
- Mac OS doesn’t like browser windows running the background (use headless)
- The Chromium version of Electron lags a few versions behind the main build (naturally)
Feature History (based on user feedback and research)
- Elements tool was first – everybody uses that one
- Network tool was next
- Re-architected the extension to allow for contribution without having to download and build the whole of Chromium
- Allowed for any version of Edge (previously only Canary)
- Added Edge driver as a dependency – earlier you needed to install both extensions
- Headless Mode
- Themes (Dark/Light)
The extension is open source and available on GitHub. We deal with all of our feature requests and user interaction there. We’d love to hear from you and see what you can come up with. The features of this extension are driven by user requests and telemetry in the browser developer tools and we want to build what you need. So please, tell us what’s missing.
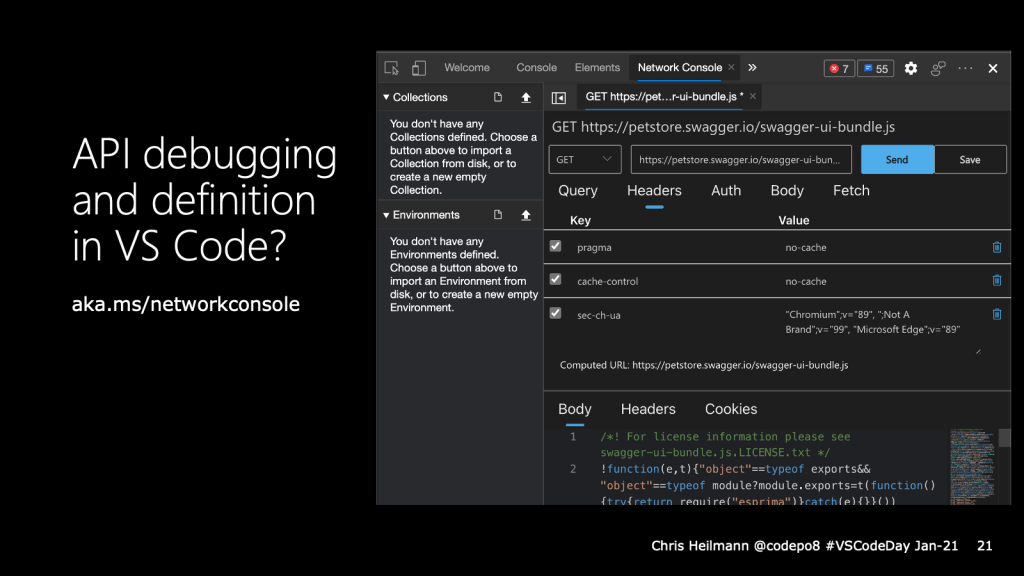
That said, one idea we have right now is to make yet another context switch unnecessary.
It is great that you can already inspect network traffic in the browser developer tools. But when things go wrong with an API call you still have to use a third-party tool or the terminal.
This is why we added an experiment that allows you to ”edit and resend” any network request. Editing the request opens the Network Console, which allows you to tweak the request parameters, authentication options or even import API collections and environments. That way you could fix any API issue directly in Visual Studio Code. What do you think? Tell us on GitHub.
And that’s all we have time for. I’d love for you to give the developer tools extension a spin and come to GitHub to work with us!