Debugging JavaScript – console.loggerheads?
Saturday, July 8th, 2017 at 6:35 pmThe last two days I ran a poll on Twitter asking people what they use to debug JavaScript.
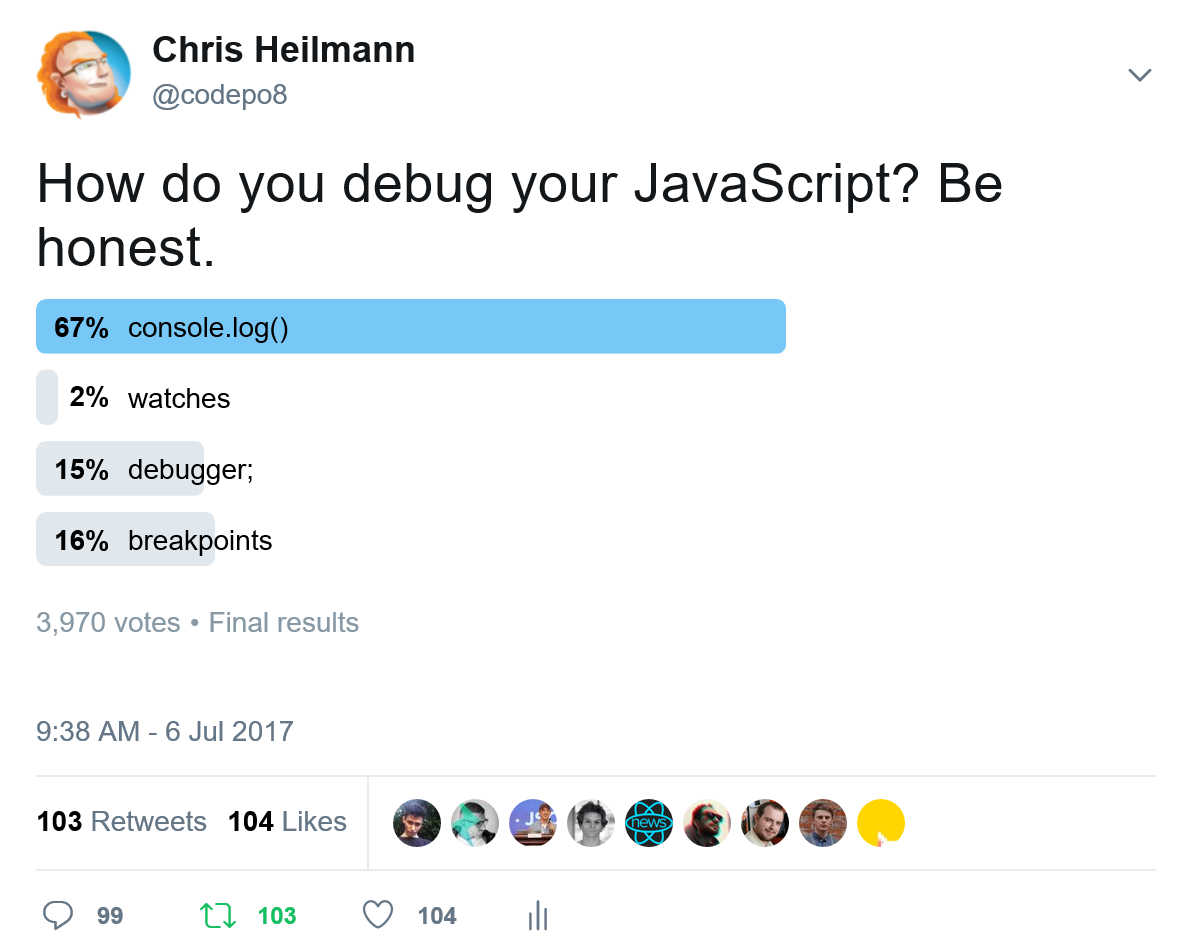
console.log()which means you debug in your editor and add and remove debugging steps there- watches which means you instruct the (browser) developer tools to log automatically when changes happen
debugger;which means you debug in your editor but jump into the (browser) developer tools- breakpoints which means you debug in your (browser) developer tools
The reason was that having worked with editors and developer tools in browsers, I was curious how much either are used. I also wanted to challenge my own impression of being a terrible developer for not using the great tools we have to the fullest. Frankly, I feel overwhelmed with the offerings and choices we have and I felt that I am pretty much set in my ways of developing.
Developer tools for the web have been going leaps and bounds in the last years and a lot of effort of browser makers goes into them. They are seen as a sign of how important the browser is. The overall impression is that when you get the inner circle of technically savvy people excited about your product, the others will follow. Furthermore, making it easier to build for your browser and giving developers insights as to what is going on should lead to better products running in your browser.
I love the offerings we have in browser developer tools these days, but I don’t quite find myself using all the functionality. Turns out, I am not alone:
The results of 3970 votes in my survey where overwhelmingly in favour of console.log() as a debugging mechanism.
Both the Twitter poll and its correlating Facebook post had some interesting reactions.
- As with any too simple poll about programming, a lot of them argued with the questioning and rightfully pointed out that people use a combination of all of them.
- There was also a lot of questioning why
alert()wasn’t an option as this is even easier than console(). - There was quite some confusion about
debugger;– seems it isn’t that common - There was only a small amount of trolling – thanks.
- There was also quite a few mentions of how tests and test driven development makes debugging unimportant.
There is no doubt that TDD and tests make for less surprises and are good development practice, but this wasn’t quite the question here. I also happily discard the numerous mentions of “I don’t make mistakes”. I was pretty happy to have had only one mention of document.write() although you do still see it a lot in JavaScript introduction courses.
What this shows me is a few things I’ve encountered myself doing:
- Developers who’ve been developing in a browser world have largely been conditioned to use simple editors, not IDEs. We’ve been conditioned to use a simple
alert()orconsole.log()in our code to find out that something went wrong. In a lot of cases, this is “good enough” - With browser developer tools becoming more sophisticated, we use breakpoints and step-by-step debugging when there are more baffling things to figure out. After all,
console.log()doesn’t scale when you need to track various changes. It is, however, not our first go-to. This is still adding something in our code, rather than moving away from the editor to the debugger - I sincerely hope that most of the demands for
alert()were in a joking fashion. Alert had its merits, as it halted the execution of JavaScript in a browser. But all it gives you is a string and a display of[object object]is not the most helpful.
Why aren’t we using breakpoint debugging?
There should not be any question that breakpoint debugging in vastly superior to simply writing values into the console from our code:
- You get proper inspection of the whole state and environment instead of one value
- You get all the other insights proper debuggers give you like memory consumption, performance and so on
- It is a cleaner way of development. All that goes in your code is what is needed for execution. You don’t mix debugging and functionality. A stray
console.log()can give out information that could be used as an attack vector. A forgottenalert()is a terrible experience for our end users. A forgotten “debugger;” or breakpoint is a lot less likely to happen as it does pause execution of our code. I also remember that in the past,console.log()in loops had quite a performance impact of our code.
Developers who are used to an IDE to create their work are much more likely to know their way around breakpoint debugging and use it instead of extra code. I’ve been encountering a lot of people in my job that would never touch a console.log() or an alert() since I started working in Microsoft. As one response of the poll rightfully pointed out it is simpler:
It's even longer to write console.log than to put a breakpoint...
— Chen Eshchar (@cheneshchar) July 6, 2017
So, why do we then keep using console logging in our code rather than the much more superior way of debugging code that our browser tooling gives us?
I think it boils down to a few things:
- Convenience and conditioning – we’ve been doing this for years, and it is easy. We don’t need to change and we feel familiar with this kind of back and forth between editor and browser
- Staying in one context – we write our code in our editors, and we spent a lot of time customising and understanding that one. We don’t want to spend the same amount of work on learning debuggers when logging is good enough
- Inconvenience of differences in implementation – whilst most debuggers work the same there are differences in their interfaces. It feels taxing to start finding your way around these.
- Simplicity and low barrier of entry – the web became the big success it is by being independent of platform and development environment. It is simple to show a person how to use a text editor and debug by putting
console.log()statements in your JavaScript. We don’t want to overwhelm new developers by overloading them with debugger information or tell them that they need a certain debugging environment to start developing for the web.
The latter is the big one that stops people embracing the concept of more sophisticated debugging workflows. Developers who are used to start with IDEs are much more used to breakpoint debugging. The reason is that it is built into their development tools rather than requiring a switch of context. The downsides of IDEs is that they have a high barrier to entry. They are much more complex tools than text editors, many are expensive and above all they are huge. It is not fun to download a few Gigabyte for each update and frankly for some developers it is not even possible.
How I started embracing breakpoint debugging
One thing that made it much easier for me to embrace breakpoint debugging is switching to Visual Studio Code as my main editor. It is still a light-weight editor and not a full IDE (Visual Studio, Android Studio and XCode are also on my machine, but I dread using them as my main development tool) but it has in-built breakpoint debugging. That way I have the convenience of staying in my editor and I get the insights right where I code.
For a node.js environment, you can see this in action in this video:
Are hackable editors, linters and headless browsers the answer?
I get the feeling that this is the future and it is great that we have tools like Electron that allow us to write light-weight, hackable and extensible editors in TypeScript or just plain JavaScript. Whilst in the past the editor you use was black arts for web developers we can now actively take part in adding features to them.
I’m even more a fan of linters in editors. I like that Word tells me I wrote terrible grammar by showing me squiggly green or red underlines. I like that an editor flags up problems with your code whilst you code it. It seems a better way to teach than having people make mistakes, load the results in a browser and then see what went wrong in the browser tools. It is true that it is a good way to get accustomed to using those and – let’s be honest – our work is much more debugging than coding. But by teaching new developers about environments that tell them things are wrong before they even save them we might turn this ratio around.
I’m looking forward to more movement in the editor space and I love that we are able to run code in a browser and get results back without having to switch the user context to that browser. There’s a lot of good things happening and I want to embrace them more.
We build more complex products these days – for good or for worse. It may be time to reconsider our development practices and – more importantly – how we condition newcomers when we tell them to work like we learned it.