Datatable to barchart without images, libraries or plugins
Thursday, August 16th, 2012 at 8:13 pmFollowing the results of a survey on library use by developers I was asked to make it easier to do a head to head comparison of the data of one of the questions. I thought it’d be interesting to start a dynamic bar chart from scratch and it is incredible just how easy these things are nowadays.
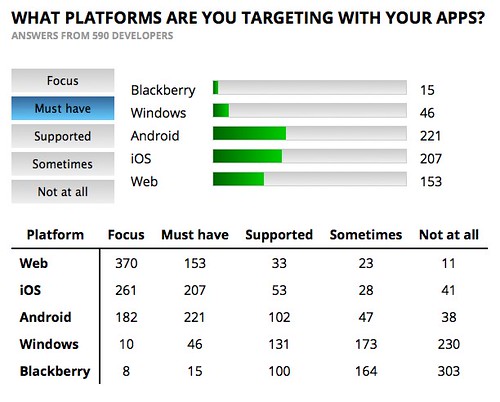
Here is the final result:
The code is available on GitHub and you can see it in action there, too.
Check the code comments to see what I did – there is no magic in there, just using what browsers give us these days.
There is a bit more to it as I explain in this Screencast on YouTube:
If you don’t want the barcharts to show up but check if meter or progress is supported instead, add a parameter to the URL:
- Plain data table (no JavaScript experience)
- Barchart version
- Meter (on Webkit/Opera) or Progress (on Firefox) version
This is an interesting little demo as you’d probably be tempted to use meter from the get-go, but thinking about the data here makes a data table the best starting point.