The data.gov.uk release yesterday was a great event. UK House Prices got applauded, I sat next to Tim Berners-Lee and I managed to pester people from the government to have me come around and showcase YQL!
Gource is a very sexy visualisation of Git commits, forks and so on.
Metal Slug sprites is a collection of all the sprites in all their pixely goodness. Me having spent a lot of time pixeling stuff (notice the browser support info – this is how old this is), I am impressed.
Jennifer Aniston and Matthew Perry show us how Windows 95 works.”Look Matthew I’m computing!”
Want to buy a jumbo jet? Comes with slight water damage – yes, this is the Hudson River one.
Tickery shows you which other people two people on Twitter follow.
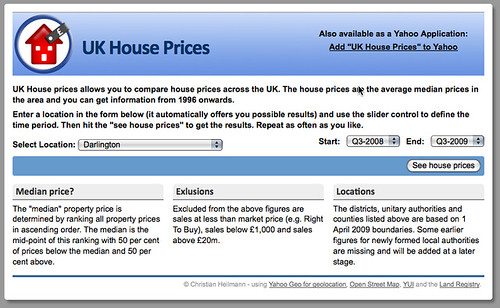
UK-House-Prices.com is a web site to see how the prices in a certain area changed over the years using a data set released by the UK government as part of the data.gov.uk initiative.
The first step was to get the right data. I was lucky enough to be invited to the initial “hack day” and pre-release of the data and looked around for something to mash up. Initially I wanted to do something with environmental data but I found a lot of it to be very old. Therefore I just did a search for “2009” at data.gov.uk and found that the house prices data from 1996 to now in England and Wales is available. The plan was set. This was it:
I wanted to build an interface to show this information that was very fast, very portable and show a nice map of the area next to the numbers.
I wanted to build this as a web app and as an application for the Yahoo homepage (as I needed to build one as a demo anyways)
Traffic and speed was the most important issue – as this might get huge.
Cleaning and converting data
I got the spreadsheet and was confronted with my old nemesis: Excel. After saving the sheet as CSV and spending some fun time regular expressions and split() I had the data in a cleaner, and more usable version (JSON, specifically). One fun part is that when there was no data available for a certain area the field was either “..”, “n/a” or just empty. Something to work around. The numbers were also formatted like 100,312 which is nice on the eye but needs un-doing when you want to sort them outside Excel.
Once I had the list of locations and their numbers I wanted to turn them into geographical locations to display maps of the area. For this I used Yahoo Placemaker, especially the YQL table (see an example for Rugby in the YQL console). This is the script I ran over the list of locations:
The next thing I wanted to add was some more information about the area which meant using maps. As both Yahoo and Google maps have static map versions but are rate limited I wondered if there is a free version of that. And there is. Openstreetmap was the answer, especially the somewhat unofficial API I found with Google. To play safe, I wrote a script that gets the images and I cache it on my server to avoid killing this API.
I also wanted to show currently available houses in the area in case you are looking to buy. For this the natural choice for me was to use Nestoria as they also have an open YQL table (see the Nestoria table in the YQL console). So I used YQL and sorted the results by date:
select * from nestoria.search where place_name="Rugby" | sort(field='updated_in_days')
Price: ‘.($r->price_formatted).’, Type of property: ‘.ucfirst($r->property_type).’, Updated: ‘.($r->updated_in_days_formatted).’ (‘.($r->updated_in_days).’ days)
‘;
echo ‘
Listed at: ‘.($r->datasource_name).’ by ‘.($r->lister_name).’.
‘;
echo ‘
‘;
}
echo ‘
‘;
}
}
Finding a charting solution
Adding interactive charts was the next step. I had a few issues with that:
While Google charts are full of win, they are rate-limited and I didn’t want to pull images. As the app was also meant to become a Yahoo application every image would have to be run through Caja for safety reasons which slowed it down.
Canvas and Flash solutions like YUI charts or Raphael were also not possible because of the performance of the YAP app.
I put all these solutions together and built a small API that will give me the search results with three parameters: the location as an id and the start and end of the time range.
To build the interface, I went all-out YUI. I took the YUI grids builder to create the main layout, the AutoComplete demo, the dual slider demo and the button and put them all together. Add an Ajax call to the form, and you are done. OK, I admit, there was quite a bit of cleaning up to be done :)
Notice that I am using progressive enhancement all the way. Without JavaScript you get dropdowns:
That’s it
The next thing I had to do is move the app over to the Yahoo Application Platform which was easy as I based it on an API - but this is another blog post :)
I was very unhappy with my job in the last few weeks. This might come as a surprise, seeing the amount of things I have released. The reason is that I am like Brian of Spaced – if I am annoyed, bored or angry I do some work to use that energy. There are a few reasons for this and I am tackling all of them and I am already feeling much better. However, I found that some of the things that annoyed me are beyond my reach and are caused actually by the developer community itself.
I am sure that people are not aware of how much impact some of things we say in public have, and I think it is time to talk about them. So over time, I will point out some of the things that makes me angry, just to let you know.
Here’s the first: The big issue “but” comment. The pattern is always the same:
“Oh wow, this is so cool, but I don’t know if I will use that because of {insert unrelated, non-verified and non-researched truism of some news site or tech blog or TechCrunch here}.”
You know what? This but hurts. It doesn’t hurt because of the “reason” stated (yes most of the time it is about shutting down GeoCities in my case). It hurts because it does two things:
It diminishes what I have done – “it is lovely and great stuff but what about the real important thing here”
It leaves me with a feeling of having wasted my time. In 99.9999999987% of the cases I have no way to have any influence in the decision that lead to the “other thing”. In many cases I learnt about it from the press. This is just how big “big” companies are. I have no influence and can not change the other thing – at all. So if that is what people want to get excited about, so much that they think they have to tell me on my blog or some comment on an article I published, then I am concentrating on the wrong thing.
I can change and influence and make a good example in the company and to the outside world with what I do. What I do I give out for free – most of the time before asking my employer if that is OK (much faster this way).
Giving things out for free is anathema to most companies (unless it is plastic things with the logo on it) – especially when these things meant that one of the company experts spent time on it. That is a fact and a very short-sighted attitude we need to change.
I am happy that I am in a company that values what I do. This does not mean that I don’t need to explain myself and show what value giving things out for free brings to the company. It is a pretty challenging and interesting position as I am not marketing or PR. I can easily transform to these roles and have a more ordered life (probably more boring,too) but I don’t want to.
I want companies to realise that there is a massive potential in opening your systems and allowing people to use your data. Your but keeps me and all my colleagues in other companies (Microsoft, Adobe, Google, Facebook, Sun…) from concentrating on that. Complain where things can be changed, get annoyed and make your voice heard where it makes a difference and don’t blow things out of proportion. I can understand the reasons for but comments:
Lack of interest to research the matter – it is much easier to repeat a strongly worded “argument” than to read up what happened. This is what a lot of people do with politics, too.
Cutting down to size – “OK, makes sense, but hey, you also do bad things” – Duh, really?
Competition – questioning things is great, but please follow your complain up with a better version (it is open source). Or at least admit that you question for sake of questioning. The devil has a massive amount of advocates these days.
In conclusion: I love comments and reports that contain a but and show a real problem that needs fixing. I am sick and tired of those that are off-topic and give the impression that you cannot use anything a big company does because something completely different happened to it. Get off my back and let me do my job. Large companies have the manpower, infrastructure and money to help a lot of developers out there have a much easier life. If the developer community feedback shows there is not much interest but it is more important to complain, why should they bother?
TechCrunch finally started pimping bling, subsequently crashing the site that sells bling versions of your twitter name. I wait for the collectible plates and the Michael Arrington action figure with awesome sentences like “I have confidential Twitter documents”.
RelFinder is a pretty awesome relationship finder and visualisation in dbpedia.